---
Order: 4
Area: typescript
TOCTitle: Debugging
ContentId: 19c60eb6-662b-444a-92f6-009642cc1e5b
PageTitle: TypeScript debugging with Visual Studio Code
DateApproved: 3/7/2019
MetaDescription: TypeScript debugging with Visual Studio Code.
MetaSocialImage: images/typescript-tutorial/Languages_typescript.png
---
# Debugging TypeScript
Visual Studio Code supports TypeScript debugging through its built-in [Node.js debugger](/docs/nodejs/nodejs-debugging.md) and also through [extensions](/docs/editor/extension-gallery.md) like [Debugger for Chrome](https://marketplace.visualstudio.com/items?itemName=msjsdiag.debugger-for-chrome) to support client-side TypeScript debugging.
## JavaScript source map support
TypeScript debugging supports JavaScript source maps. To generate source maps for your TypeScript files, compile with the `--sourcemap` option or set the `sourceMap` property in the `tsconfig.json` file to `true`.
In-lined source maps (a source map where the content is stored as a data URL instead of a separate file) are also supported, although in-lined source is not yet supported.
For a simple example of source maps in action, see the [TypeScript tutorial](/docs/typescript/typescript-tutorial.md), which shows debugging a simple "Hello World" Node.js application using the following `tsconfig.json` and VS Code default Node.js debugging configuration.
```json
{
"compilerOptions": {
"target": "es5",
"module": "commonjs",
"outDir": "out",
"sourceMap": true
}
}
```
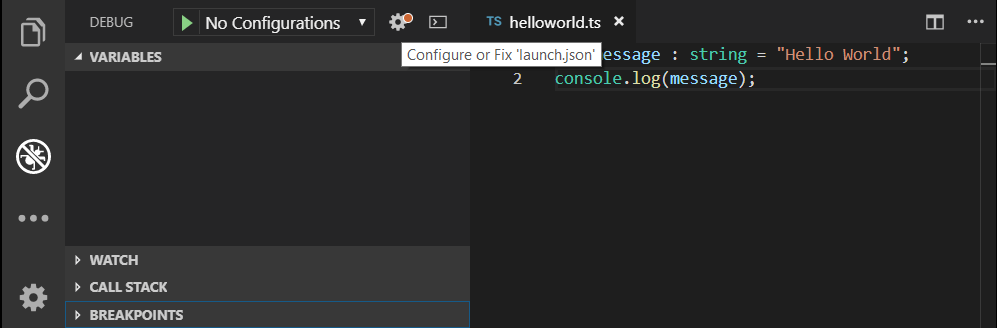
For more advanced debugging scenarios, you can create your own debug configuration `launch.json` file. To see the default configuration, go to the Debug view (`kb(workbench.view.debug)`) and press the gear icon to **Configure or Fix 'launch.json'**. If you have other debugger extensions installed (such as the Debugger for Chrome), you should select **Node.js** from the drop down.
This will create a `launch.json` file in a `.vscode` folder with default values detected in your project.
```json
{
// Use IntelliSense to learn about possible attributes.
// Hover to view descriptions of existing attributes.
// For more information, visit: https://go.microsoft.com/fwlink/?linkid=830387
"version": "0.2.0",
"configurations": [
{
"type": "node",
"request": "launch",
"name": "Launch Program",
"program": "${workspaceFolder}/helloworld.ts",
"preLaunchTask": "tsc: build - tsconfig.json",
"outFiles": [
"${workspaceFolder}/out/**/*.js"
]
}
]
}
```
VS Code has determined the program to launch, `helloworld.ts`, included the build as a `preLaunchTask`, and told the debugger where to find the generated JavaScript files.
There is full IntelliSense with suggestions and information for `launch.json` to help you learn about other debug configuration options. You can also add new debug configurations to `launch.json` with the **Add Configuration** button in the lower right.

Also see [Node.js Debugging](/docs/nodejs/nodejs-debugging.md) for examples and further explanations.
## Mapping the output location
If generated (transpiled) JavaScript files do not live next to their source, you can help the VS Code debugger locate them by setting the `outFiles` attribute in the launch configuration. Whenever you set a breakpoint in the original source, VS Code tries to find the generated source by searching the files specified by glob patterns in `outFiles`.
## Client-side debugging
TypeScript is great for writing client-side code as well as Node.js applications and you can debug client-side source code with extensions such as [Debugger for Chrome](https://marketplace.visualstudio.com/items?itemName=msjsdiag.debugger-for-chrome).
We'll create a tiny web application to show client-side debugging in action.
Create a new folder `HelloWeb` and add three files: `helloweb.ts`, `helloweb.html`, and `tsconfig.json` with the following content"
helloweb.ts
```typescript
let message : string = "Hello Web";
document.body.innerHTML = message;
```
helloweb.html
```html
TypeScript Hello Web
```
tsconfig.json
```json
{
"compilerOptions": {
"target": "es5",
"module": "commonjs",
"outDir": "out",
"sourceMap": true
}
}
```
Run `tsc` to build the app and then test by opening `helloweb.html` in your browser (you can right click `helloweb.html` in the File Explorer and select **Copy Path** to paste into your browser).
To debug the client-side code, install the [Debugger for Chrome](https://marketplace.visualstudio.com/items?itemName=msjsdiag.debugger-for-chrome) [extension](/docs/editor/extension-gallery.md). Open the Extensions view (`kb(workbench.view.extensions)`) and search for "Chrome". Install the extension and reload VS Code.

In the Debug view, press the gear icon to create a `launch.json` file selecting **Chrome** as the debugger.
Update the `launch.json` to specify the local file URL to `helloweb.html`:
```json
{
"version": "0.2.0",
"configurations": [
{
"type": "chrome",
"request": "launch",
"name": "Launch Chrome against localhost",
"url": "file:///C:/Users/gregvanl/deleteMe/HelloWeb/helloweb.html",
"webRoot": "${workspaceFolder}"
}
]
}
```
The Debug view configuration dropdown will now show the new configuration **Launch Chrome against localhost**. If you run that configuration, your browser will launch with your web page. Open `helloweb.ts` in the editor and click the left gutter to add a breakpoint (it will be displayed as a red circle). Press `kb(workbench.action.debug.start)` to start the debug session, which launches the browser and hits your breakpoint in `helloweb.ts`.

## Common questions
### Cannot launch program because corresponding JavaScript cannot be found
You've likely not set `"sourceMap": true` in your `tsconfig.json` or `outFiles` in your `launch.json` and the VS Code Node.js debugger can't map your TypeScript source code to the running JavaScript. Turn on source maps and rebuild your project.