Spaces:
Runtime error
Runtime error

| import gradio as gr | |
| import tensorflow as tf | |
| from keras.models import load_model | |
| import os | |
| os.environ["TF_CPP_MIN_LOG_LEVEL"] = "2" | |
| os.environ["SM_FRAMEWORK"] = "tf.keras" | |
| import segmentation_models as sm | |
| from keras.metrics import MeanIoU | |
| def jaccard_coef(y_true, y_pred): | |
| """ | |
| Defines custom jaccard coefficient metric | |
| """ | |
| y_true_flatten = K.flatten(y_true) | |
| y_pred_flatten = K.flatten(y_pred) | |
| intersection = K.sum(y_true_flatten * y_pred_flatten) | |
| final_coef_value = (intersection + 1.0) / (K.sum(y_true_flatten) + K.sum(y_pred_flatten) - intersection + 1.0) | |
| return final_coef_value | |
| def real_dice_coeff(y_true, y_pred): | |
| smooth = 0.0001 | |
| y_true_flatten = K.flatten(y_true) | |
| y_pred_flatten = K.flatten(y_pred) | |
| intersection = K.sum(y_true_flatten * y_pred_flatten) | |
| dice_score = (2.0 * intersection + smooth) / (K.sum(y_true_flatten) + K.sum(y_pred_flatten) + smooth) | |
| return dice_score | |
| dice_loss = sm.losses.DiceLoss(class_weights = weights) | |
| focal_loss = sm.losses.CategoricalFocalLoss() | |
| TOTAL_LOSS_FACTOR = 5 | |
| total_loss = dice_loss + (TOTAL_LOSS_FACTOR * focal_loss) | |
| metrics = [real_dice_coeff, tf.keras.metrics.MeanIoU(num_classes=2, sparse_y_true= False, sparse_y_pred=False, name="Mean IOU"), "accuracy", jaccard_coef, sm.metrics.FScore(threshold=0.6, name="Dice Coeficient")] | |
| model = load_model('../../../fast-disk/w210-capstone/models/' + model_name, custom_objects={'dice_loss_plus_5focal_loss': total_loss, 'jaccard_coef': jaccard_coef, 'IOU score' : sm.metrics.IOUScore(threshold=0.9, name="IOU score"), 'Dice Coeficient' : sm.metrics.FScore(threshold=0.6, name="Dice Coeficient")}, compile=False) | |
| model.compile(metrics=metrics) | |
| # def greet(name): | |
| # return "Hello " + name + "!!" | |
| # iface = gr.Interface(fn=greet, inputs="text", outputs="text") | |
| # iface.launch() | |
| # first we need to load the model from somewhere - probably by using model.load on a keras file (which could be saved in our huggingface space repo) | |
| # once we have a model, we use tensorflow to run inference and create a visualization of the output mask | |
| # just like we did in our main code like such: | |
| # model_name = "something.keras" (which should be saved in our HF repo) | |
| # model = load_model(model_name) | |
| # model.compile(?) | |
| # then we save that inference + viz task in a function called "make mask" which takes an input image, processes it, runs the model on it, and returns a mask image | |
| # within this function we can use functions like display_image_and_label (and the functions that that function calls to make predictions) | |
| # instead of just printing the visualization, we have the function return the image output | |
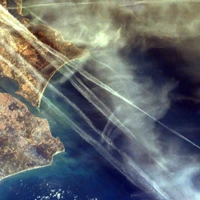
| #description = "<p style='text-align: center'>Gradio demo for identifying contrails in satellite images. </p>" | |
| #css = "#0 {object-fit: contain;} #1 {object-fit: contain;}" | |
| #demo = gr.Interface(fn=make_mask, | |
| # title=title, | |
| # description=description, | |
| # inputs= # either the use input or one we save as a file, | |
| # outputs=gr.Image(elem_id=1, show_label=False), | |
| # css=css, | |
| # examples=examples, | |
| # cache_examples=True, | |
| # allow_flagging='never') | |
| #demo.launch() | |