

AI999X Scientific Models
Collection
All 31 AI999X scientific models: offline solvers with exact, step-by-step answers across 7 fields (2,696 capabilities). • 31 items • Updated
Geospatial Analytics covers map projections and coordinates, geodesic distance and area, spatial statistics, remote-sensing indices, solar position and terrain, and urban and network analysis: 99 calculations in 14 topics, each with its formula, its steps and its units, and a plain reason instead of a number when an input is missing or out of range. One compiled engine, four ways to use it: the desktop app, the command line, the browser and Python. Everything runs on your own computer, offline.
| Desktop app (Windows, Linux) | Windows · Linux |
Command line geospatial-analytics (Windows, Linux) |
Windows · Linux |
| Browser (any device) | Try it on the model page |
| Python 3.10+ | pip install geospatial-analytics-ai999x: on Windows and Linux (x86-64) pip installs the same compiled engine; on other systems (macOS, ARM) it installs a pure-Python build that gives the same answers |
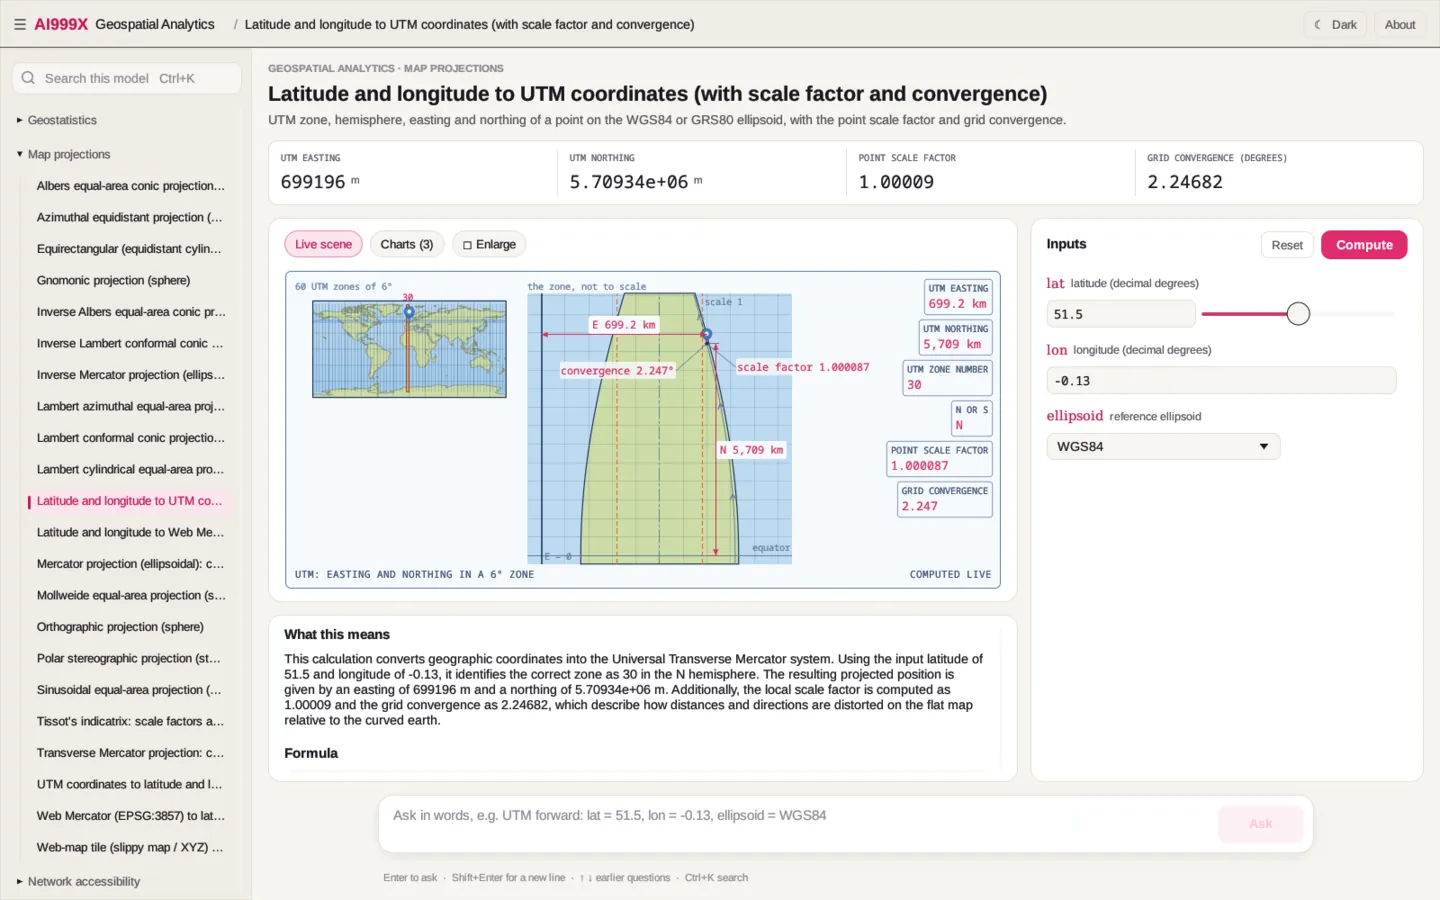
From the Geospatial Analytics desktop app: every scene and chart is drawn from the computed answer.
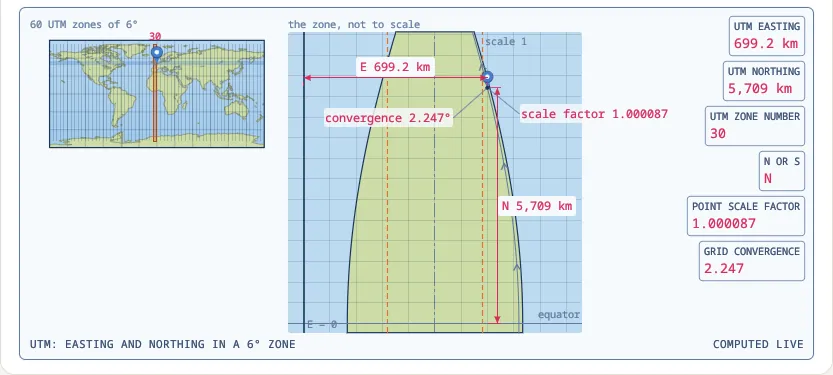 Latitude and longitude to UTM coordinates (with scale factor and convergence) |
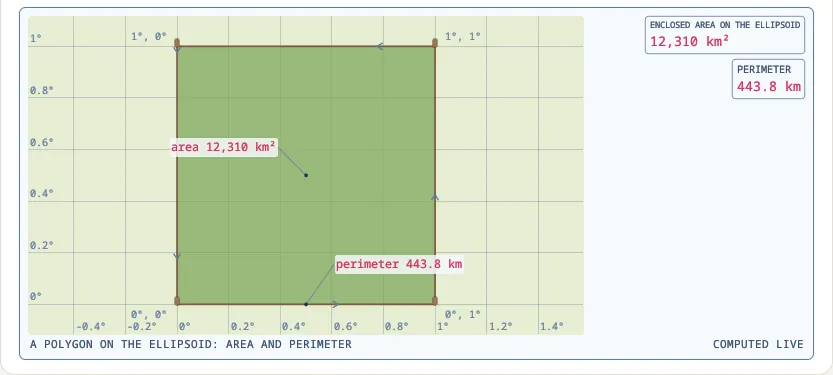 Area and perimeter of a geodesic polygon on the ellipsoid |
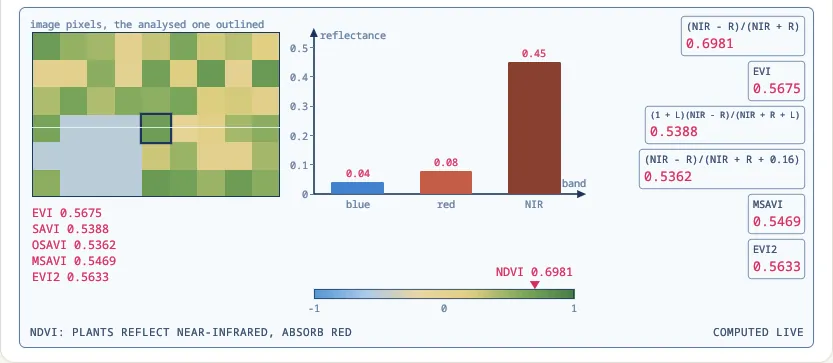 Vegetation indices: NDVI, EVI, SAVI, OSAVI, MSAVI and EVI2 from band reflectances |
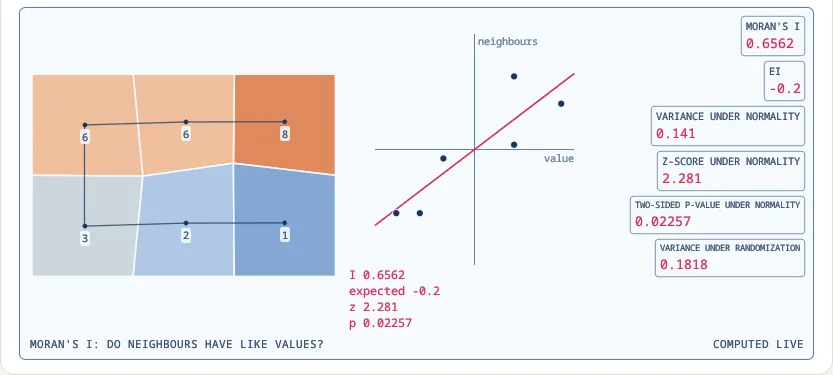 Global Moran's I spatial autocorrelation with normal and randomization inference |
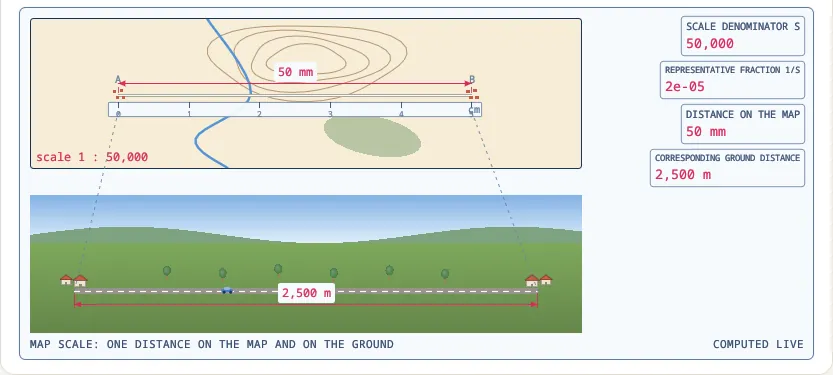 Map scale (representative fraction) from a map and a ground distance |
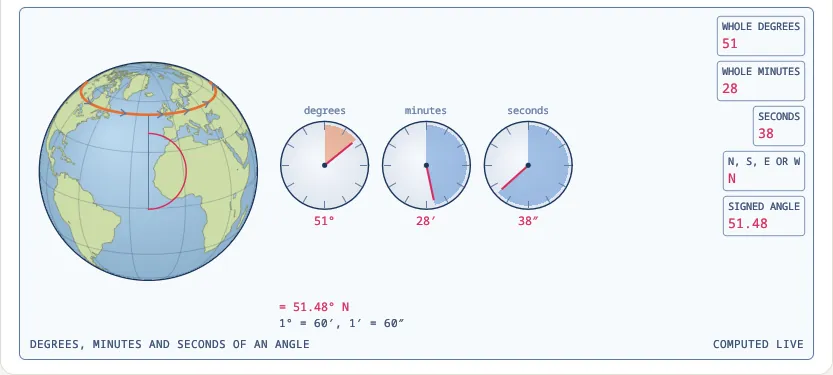 Decimal degrees to degrees, minutes and seconds |
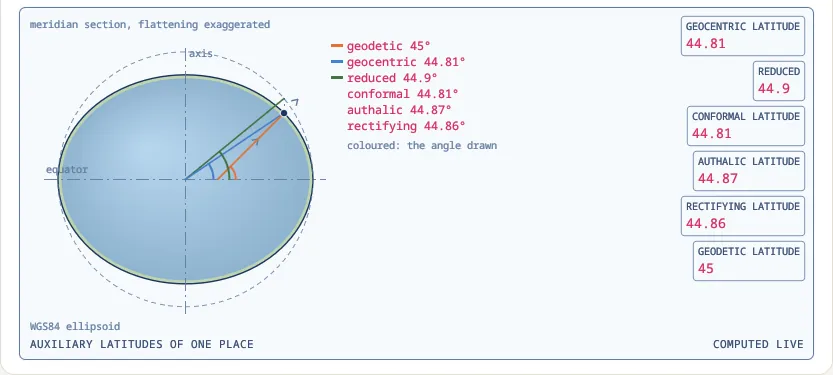 Auxiliary latitudes: geocentric, reduced, conformal, authalic and rectifying |
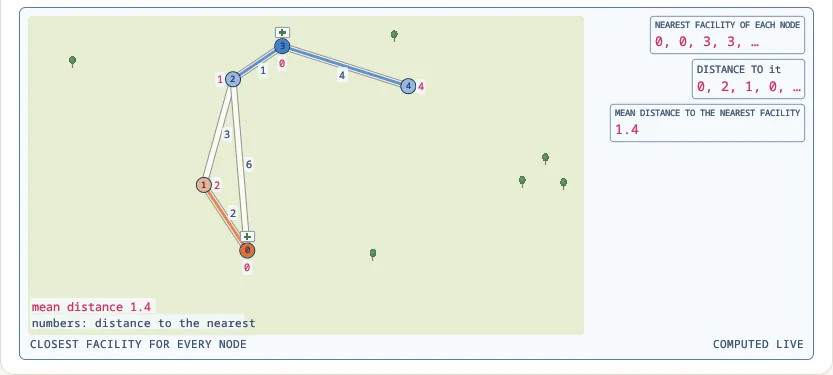 Closest facility for every node of a network |
Charts:
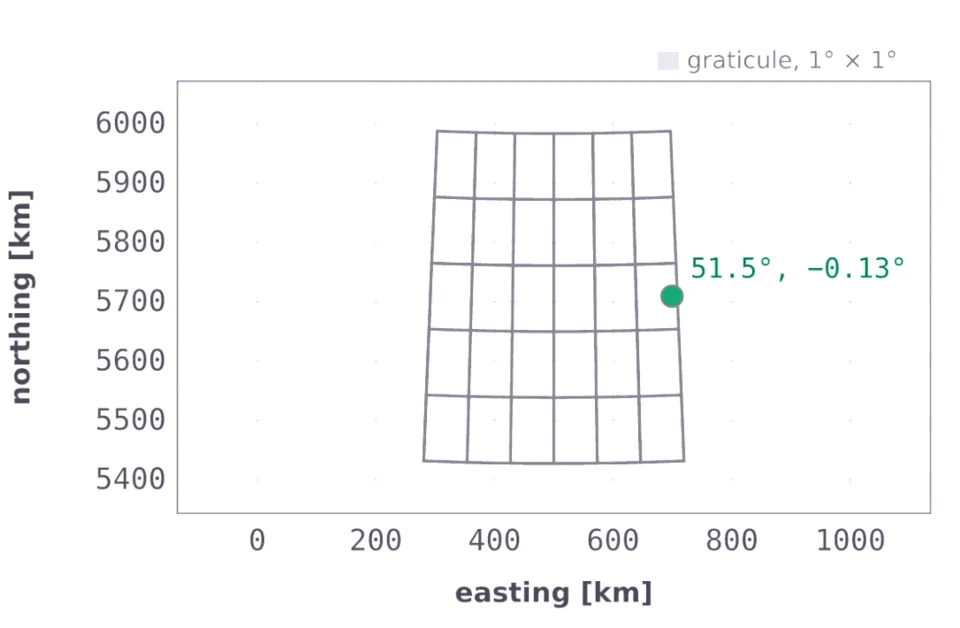 Latitude and longitude to UTM coordinates (with scale factor and convergence) |
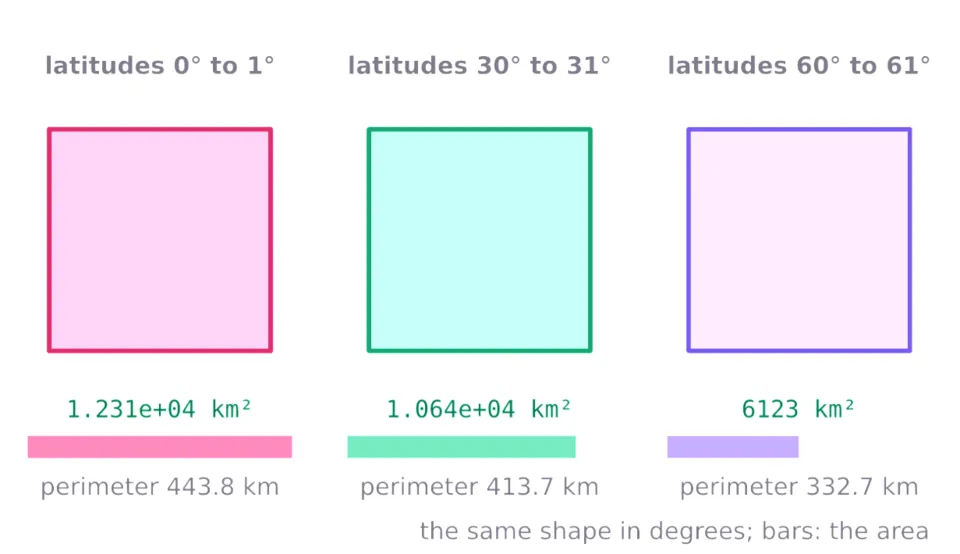 Area and perimeter of a geodesic polygon on the ellipsoid |
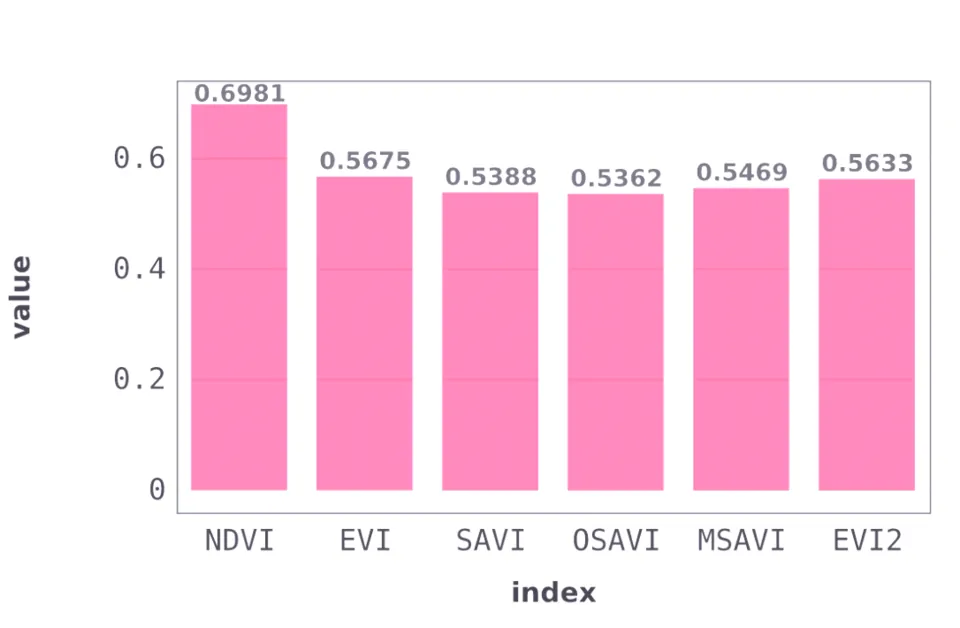 Vegetation indices: NDVI, EVI, SAVI, OSAVI, MSAVI and EVI2 from band reflectances |
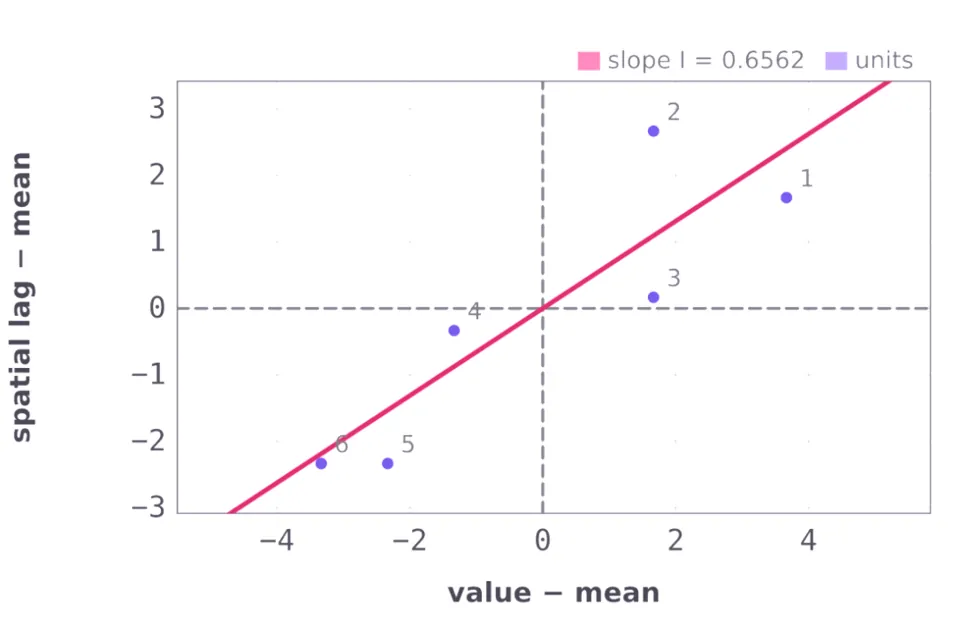 Global Moran's I spatial autocorrelation with normal and randomization inference |
Each question below was asked on this release; the comment under it is the line it printed.
import geospatial_analytics_ai999x as geospatial_analytics

a = geospatial_analytics.ask(
    "Map scale ground distance: map_distance = 4.2 cm, scale = 50000"
)
print(a.outcome, a.values)
# SOLVED {'ground_distance': 2100.0, 'ground_km': 2.1}

a = geospatial_analytics.ask(
    "Parallel arc length: lat = 60, lon1 = 0, lon2 = 1, ellipsoid = "
    "WGS84"
)
print(a.outcome, a.values)
# SOLVED {'distance': 55800.0015724, 'radius': 3197104.58692}

a = geospatial_analytics.ask(
    "Frechet distance: x1 = [0, 1, 2], y1 = [0, 0, 0], x2 = [0, 2], y2 "
    "= [1, 1]"
)
print(a.outcome, a.values)
# SOLVED {'distance': 1.4142135623730951}

a = geospatial_analytics.ask(
    "Kernel density: x = [0, 1, 2, 5], y = [0, 1, 0, 5], px = 1, py = "
    "0.5, bandwidth = 2, kernel = gaussian"
)
print(a.outcome, a.values)
# SOLVED {'density': 0.0267647992836, 'intensity': 0.107059197135}

a = geospatial_analytics.ask(
    "Brightness temperature: radiance = 10.5, K1 = 774.8853, K2 = "
    "1321.0789"
)
print(a.outcome, a.values)
# SOLVED {'T': 306.173902537}

a = geospatial_analytics.ask(
    "Bivariate Moran's I: x = [8, 6, 6, 3, 2, 1], y = [7, 7, 5, 4, 1, "
    "2], W = [[0, 1, 0, 0, 0, 0], [1, 0, 1, 0, 0, 0], [0, 1, 0, 1, 0, "
    "0], [0, 0, 1, 0, 1, 0], [0, 0, 0, 1, 0, 1], [0, 0, 0, 0, 1, 0]]"
)
print(a.outcome, a.values)
# SOLVED {'I_xy': 0.891760344576}

a = geospatial_analytics.ask(
    "Map scale from distances: map_distance = 5 cm, ground_distance = "
    "2.5 km"
)
print(a.outcome, a.values)
# SOLVED {'scale': 50000.0, 'rf': 2e-05}

a = geospatial_analytics.ask(
    "ECEF to geodetic: X = 4517590.879 m, Y = 796576.168 m, Z = "
    "4487348.409 m, ellipsoid = WGS84"
)
print(a.outcome, a.values)
# SOLVED {'lat': 44.5599648566, 'lon': 10.0000370024, 'h': 49468.6669929}

a = geospatial_analytics.ask(
    "Geodesic polygon area: lats = [0, 0, 1, 1], lons = [0, 1, 1, 0], "
    "ellipsoid = WGS84"
)
print(a.outcome, a.values)
# SOLVED {'area': 12308778361.5, 'perimeter': 443770.917248}

a = geospatial_analytics.ask(
    "Maximal covering location: edges = [0-1 2; 1-2 3; 0-2 6; 2-3 1; "
    "3-4 4; 4-5 2; 1-5 7], demand = [10, 20, 15, 30, 5, 25], "
    "candidates = [0, 1, 2, 3, 4, 5], p = 2, coverage = 3"
)
print(a.outcome, a.values)
# SOLVED {'covered': 95.0, 'fraction': 0.904761904762}

a = geospatial_analytics.ask(
    "Mean center and standard distance: x = [0, 4, 4, 0], y = [0, 0, "
    "3, 3]"
)
print(a.outcome, a.values)
# SOLVED {'mean_x': 2.0, 'mean_y': 1.5, 'std_distance': 2.5}

a = geospatial_analytics.ask(
    "Ground sample distance: pixel_pitch = 0.0024 mm, focal_length = "
    "8.8 mm, altitude = 120 m, pixels = 5472"
)
print(a.outcome, a.values)
# SOLVED {'gsd': 0.0327272727273, 'swath': 179.083636364}

a = geospatial_analytics.ask(
    "DMS to decimal degrees: degrees = 51, minutes = 28, seconds = 38, "
    "hemisphere = N"
)
print(a.outcome, a.values)
# SOLVED {'decimal': 51.477222222222224, 'radians': 0.898447017559}

a = geospatial_analytics.ask(
    "Geodetic to ECEF: lat = 45, lon = 10, h = 100 m, ellipsoid = "
    "WGS84"
)
print(a.outcome, a.values)
# SOLVED {'X': 4449028.15885, 'Y': 784483.702337, 'Z': 4487419.11954}

a = geospatial_analytics.ask(
    "IDW interpolation: x = [0, 10, 0, 10], y = [0, 0, 10, 10], z = "
    "[1, 2, 3, 4], px = 2, py = 3, power = 2"
)
print(a.outcome, a.values)
# SOLVED {'estimate': 1.65897994017}
Each command below was run with geospatial-analytics of this release; the lines under it are the answer it printed (the full answer goes on with the method, every input in SI units and the conditions it assumes).
$ geospatial-analytics solve geo_map_scale_ground_distance "map_distance=4.2 cm" scale=50000
ground_distance = 2100 m
ground_km = 2.1

$ geospatial-analytics solve geo_decimal_to_dms decimal=51.477222 axis=latitude
degrees = 51
minutes = 28
seconds = 37.9992
hemisphere = N

$ geospatial-analytics solve geo_auxiliary_latitudes lat=45 ellipsoid=WGS84
geocentric = 44.80757678
reduced = 44.90378785
conformal = 44.80768406
authalic = 44.87170287
rectifying = 44.85568199

$ geospatial-analytics solve geo_parallel_arc lat=60 lon1=0 lon2=1 ellipsoid=WGS84
distance = 55800.00157 m
radius = 3197104.587 m

$ geospatial-analytics solve geo_closest_facility "edges=0-1 2; 1-2 3; 0-2 6; 2-3 1; 3-4 4" "facilities=0, 3"
nearest = [0.0,0.0,3.0,3.0,3.0]
distance = [0.0,2.0,1.0,0.0,4.0]
mean_distance = 1.4

$ geospatial-analytics solve geo_empirical_semivariogram "x=[0, 1, 2, 3, 4]" "y=[0, 0, 0, 0, 0]" "z=[1, 3, 2, 5, 4]" "bin_edges=[0, 1.5, 2.5, 4.5]"
gamma = [1.875,1.5,4.33333333333]
counts = [4.0,3.0,3.0]

$ geospatial-analytics solve geo_albers_equal_area_forward lat=40 lon=-100 lat1=29.5 lat2=45.5 lat0=23 lon0=-96 ellipsoid=GRS80
x = -338390.5876 m
y = 1894100.14 m
k = 0.9909686029
h = 1.009113707

$ geospatial-analytics solve geo_gravity_accessibility "edges=0-1 2; 1-2 3; 0-2 6; 2-3 1" "opportunities=100, 50, 80, 20" beta=1 impedance=power
accessibility = [44.3333333333,81.6666666667,56.6666666667,109.166666667]

$ geospatial-analytics solve geo_discrete_frechet_distance "x1=[0, 1, 2]" "y1=[0, 0, 0]" "x2=[0, 2]" "y2=[1, 1]"
distance = 1.414213562

$ geospatial-analytics solve geo_kernel_density "x=[0, 1, 2, 5]" "y=[0, 1, 0, 5]" px=1 py=0.5 bandwidth=2 kernel=gaussian
density = 0.02676479928
intensity = 0.1070591971

$ geospatial-analytics solve geo_brightness_temperature radiance=10.5 K1=774.8853 K2=1321.0789
T = 306.1739025 K

$ geospatial-analytics solve geo_bivariate_morans_i "x=[8, 6, 6, 3, 2, 1]" "y=[7, 7, 5, 4, 1, 2]" "W=[[0, 1, 0, 0, 0, 0], [1, 0, 1, 0, 0, 0], [0, 1, 0, 1, 0, 0], [0, 0, 1, 0, 1, 0], [0, 0, 0, 1, 0, 1], [0, 0, 0, 0, 1, 0]]"
I_xy = 0.8917603446

$ geospatial-analytics solve geo_d8_flow_accumulation "dem=[[78, 72, 69, 71], [74, 67, 56, 49], [69, 53, 44, 37], [64, 58, 55, 22]]" "cell_size=10 m"
accumulation = [[1.0,1.0,1.0,1.0],[1.0,2.0,2.0,3.0],[1.0,4.0,8.0,6.0],[1.0,1.0,1.0,16.0]]
max_accumulation = 16

$ geospatial-analytics solve geo_huff_model "edges=0-1 2; 1-2 3; 0-2 6; 2-3 1; 1-3 5" origin=0 "stores=1, 2, 3" "attractiveness=5000, 12000, 8000" alpha=1 beta=2
probabilities = [0.640295959021,0.245873648264,0.113830392715]
distances = [2.0,5.0,6.0]

$ geospatial-analytics solve geo_map_scale_from_distances "map_distance=5 cm" "ground_distance=2.5 km"
scale = 50000
rf = 2e-05
The crate geospatial-analytics-ai999x (in rust/ of the GitHub repository) answers a JSON request with geospatial_analytics_ai999x::solve_json. Each call below was compiled and run on this release; the comment under it is what it printed. The whole program is rust/geospatial-analytics/examples/readme.rs: cd rust && cargo run --release --example readme -p geospatial-analytics-ai999x.
use serde_json::{json, Value};

fn show(request: Value) {
    let answer: Value = serde_json::from_str(&geospatial_analytics_ai999x::solve_json(&request.to_string())).unwrap();
    println!("{}", answer["outcome"].as_str().unwrap_or(""));
    for v in answer["values"].as_array().into_iter().flatten() {
        let unit = v[2].as_str().unwrap_or("");
        let unit = if unit.is_empty() || unit == "1" { String::new() } else { format!(" {unit}") };
        println!("{} = {}{}", v[0].as_str().unwrap_or(""), v[1], unit);
    }
}

show(json!({"key": "geo_map_scale_ground_distance", "inputs": {"map_distance": "4.2 cm", "scale": "50000"}}));
// SOLVED
// ground_distance = 2100.0 m
// ground_km = 2.1

show(json!({"key": "geo_decimal_to_dms", "inputs": {"decimal": "51.477222", "axis": "latitude"}}));
// SOLVED
// degrees = 51
// minutes = 28
// seconds = 37.9992
// hemisphere = "N"

show(json!({"key": "geo_auxiliary_latitudes", "inputs": {"lat": "45", "ellipsoid": "WGS84"}}));
// SOLVED
// geocentric = 44.807576784
// reduced = 44.9037878494
// conformal = 44.8076840561
// authalic = 44.8717028734
// rectifying = 44.8556819889

show(json!({"key": "geo_parallel_arc", "inputs": {"lat": "60", "lon1": "0", "lon2": "1", "ellipsoid": "WGS84"}}));
// SOLVED
// distance = 55800.0015724 m
// radius = 3197104.58692 m

show(json!({"key": "geo_closest_facility", "inputs": {"edges": "0-1 2; 1-2 3; 0-2 6; 2-3 1; 3-4 4", "facilities": "0, 3"}}));
// SOLVED
// nearest = [0.0,0.0,3.0,3.0,3.0]
// distance = [0.0,2.0,1.0,0.0,4.0]
// mean_distance = 1.4

show(json!({"key": "geo_empirical_semivariogram", "inputs": {"x": [0, 1, 2, 3, 4], "y": [0, 0, 0, 0, 0], "z": [1, 3, 2, 5, 4], "bin_edges": [0, 1.5, 2.5, 4.5]}}));
// SOLVED
// gamma = [1.875,1.5,4.33333333333]
// counts = [4.0,3.0,3.0]

show(json!({"key": "geo_albers_equal_area_forward", "inputs": {"lat": "40", "lon": "-100", "lat1": "29.5", "lat2": "45.5", "lat0": "23", "lon0": "-96", "ellipsoid": "GRS80"}}));
// SOLVED
// x = -338390.587551 m
// y = 1894100.14004 m
// k = 0.990968602864
// h = 1.00911370664

show(json!({"key": "geo_gravity_accessibility", "inputs": {"edges": "0-1 2; 1-2 3; 0-2 6; 2-3 1", "opportunities": "100, 50, 80, 20", "beta": "1", "impedance": "power"}}));
// SOLVED
// accessibility = [44.3333333333,81.6666666667,56.6666666667,109.166666667]

show(json!({"key": "geo_discrete_frechet_distance", "inputs": {"x1": [0, 1, 2], "y1": [0, 0, 0], "x2": [0, 2], "y2": [1, 1]}}));
// SOLVED
// distance = 1.4142135623730951

show(json!({"key": "geo_kernel_density", "inputs": {"x": [0, 1, 2, 5], "y": [0, 1, 0, 5], "px": "1", "py": "0.5", "bandwidth": "2", "kernel": "gaussian"}}));
// SOLVED
// density = 0.0267647992836
// intensity = 0.107059197135

show(json!({"key": "geo_brightness_temperature", "inputs": {"radiance": "10.5", "K1": "774.8853", "K2": "1321.0789"}}));
// SOLVED
// T = 306.173902537 K

show(json!({"key": "geo_bivariate_morans_i", "inputs": {"x": [8, 6, 6, 3, 2, 1], "y": [7, 7, 5, 4, 1, 2], "W": [[0, 1, 0, 0, 0, 0], [1, 0, 1, 0, 0, 0], [0, 1, 0, 1, 0, 0], [0, 0, 1, 0, 1, 0], [0, 0, 0, 1, 0, 1], [0, 0, 0, 0, 1, 0]]}}));
// SOLVED
// I_xy = 0.891760344576

show(json!({"key": "geo_d8_flow_accumulation", "inputs": {"dem": [[78, 72, 69, 71], [74, 67, 56, 49], [69, 53, 44, 37], [64, 58, 55, 22]], "cell_size": "10 m"}}));
// SOLVED
// accumulation = [[1.0,1.0,1.0,1.0],[1.0,2.0,2.0,3.0],[1.0,4.0,8.0,6.0],[1.0,1.0,1.0,16.0]]
// max_accumulation = 16.0

show(json!({"key": "geo_huff_model", "inputs": {"edges": "0-1 2; 1-2 3; 0-2 6; 2-3 1; 1-3 5", "origin": "0", "stores": "1, 2, 3", "attractiveness": "5000, 12000, 8000", "alpha": "1", "beta": "2"}}));
// SOLVED
// probabilities = [0.640295959021,0.245873648264,0.113830392715]
// distances = [2.0,5.0,6.0]

show(json!({"key": "geo_map_scale_from_distances", "inputs": {"map_distance": "5 cm", "ground_distance": "2.5 km"}}));
// SOLVED
// scale = 50000.0
// rf = 0.00002
Every calculation, with its formula, a worked example and its figures: Geospatial Analytics on ai999x.com. Install guides for the app and the command line: https://www.ai999x.com/desktop-cli/.
Version 1.6.4 · License: Apache-2.0 · Author: Ibnul Jaif Farabi · Organization: AI999X · Contact: support@ai999x.com · Support the project
The Future Is Self-Improving.