
Example: Budget Allocator App
An interactive budget allocation tool demonstrating real-time data visualization with MCP Apps.
 |
 |
 |
Features
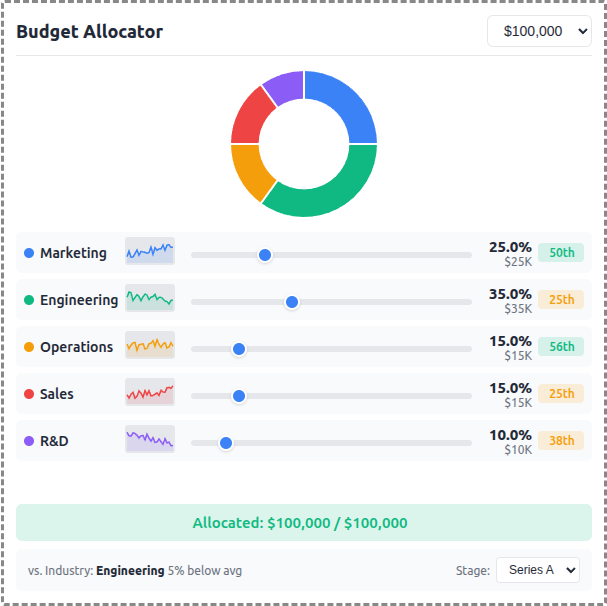
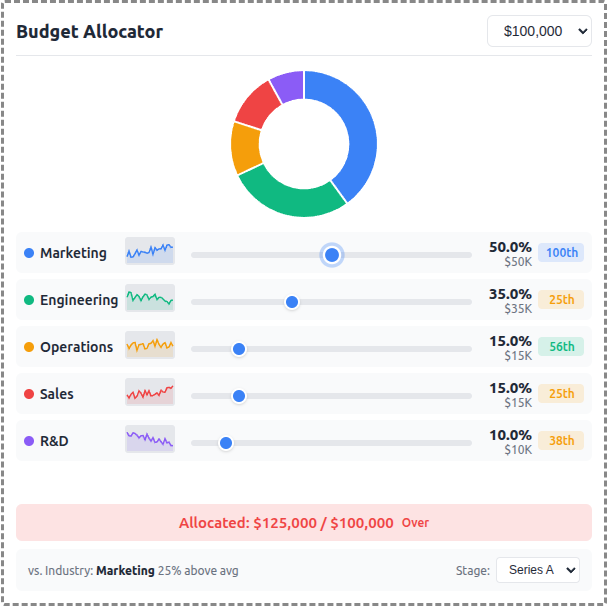
- Interactive Sliders: Adjust budget allocation across 5 categories (Marketing, Engineering, Operations, Sales, R&D)
- Donut Chart: Real-time visualization of allocation distribution using Chart.js
- Sparkline Trends: 24-month historical allocation data per category
- Percentile Badges: Compare your allocation vs. industry benchmarks
- Stage Selector: Switch between Seed, Series A, Series B, and Growth benchmarks
- Budget Presets: Quick selection of $50K, $100K, $250K, or $500K totals
Running
Install dependencies:
npm installBuild and start the server:
npm run start:http  # for Streamable HTTP transport
# OR
npm run start:stdio  # for stdio transport
View using the
basic-hostexample or another MCP Apps-compatible host.
Architecture
Server (server.ts)
Exposes a single get-budget-data tool that returns:
- Category definitions with colors and default allocations
- Historical data (~120 data points) - 24 months of allocation history per category
- Industry benchmarks (~60 data points) - Aggregated percentile data by company stage
The tool is linked to a UI resource via _meta.ui.resourceUri.
App (src/mcp-app.ts)
- Uses Chart.js for the donut chart visualization
- Renders sparkline trends using inline SVG
- Computes percentile rankings client-side from benchmark data
- Updates all UI elements reactively on slider changes