
Buckets:


| # Analytics and Metrics | |
| The Analytics page is like the control center for your deployed models. It tells you in real-time what's going on, how many users are | |
| calling your models, about hardware usage, latencies, and much more. In this documentation we'll dive into what each metric means and | |
| how to analyze the graphs. | |
| 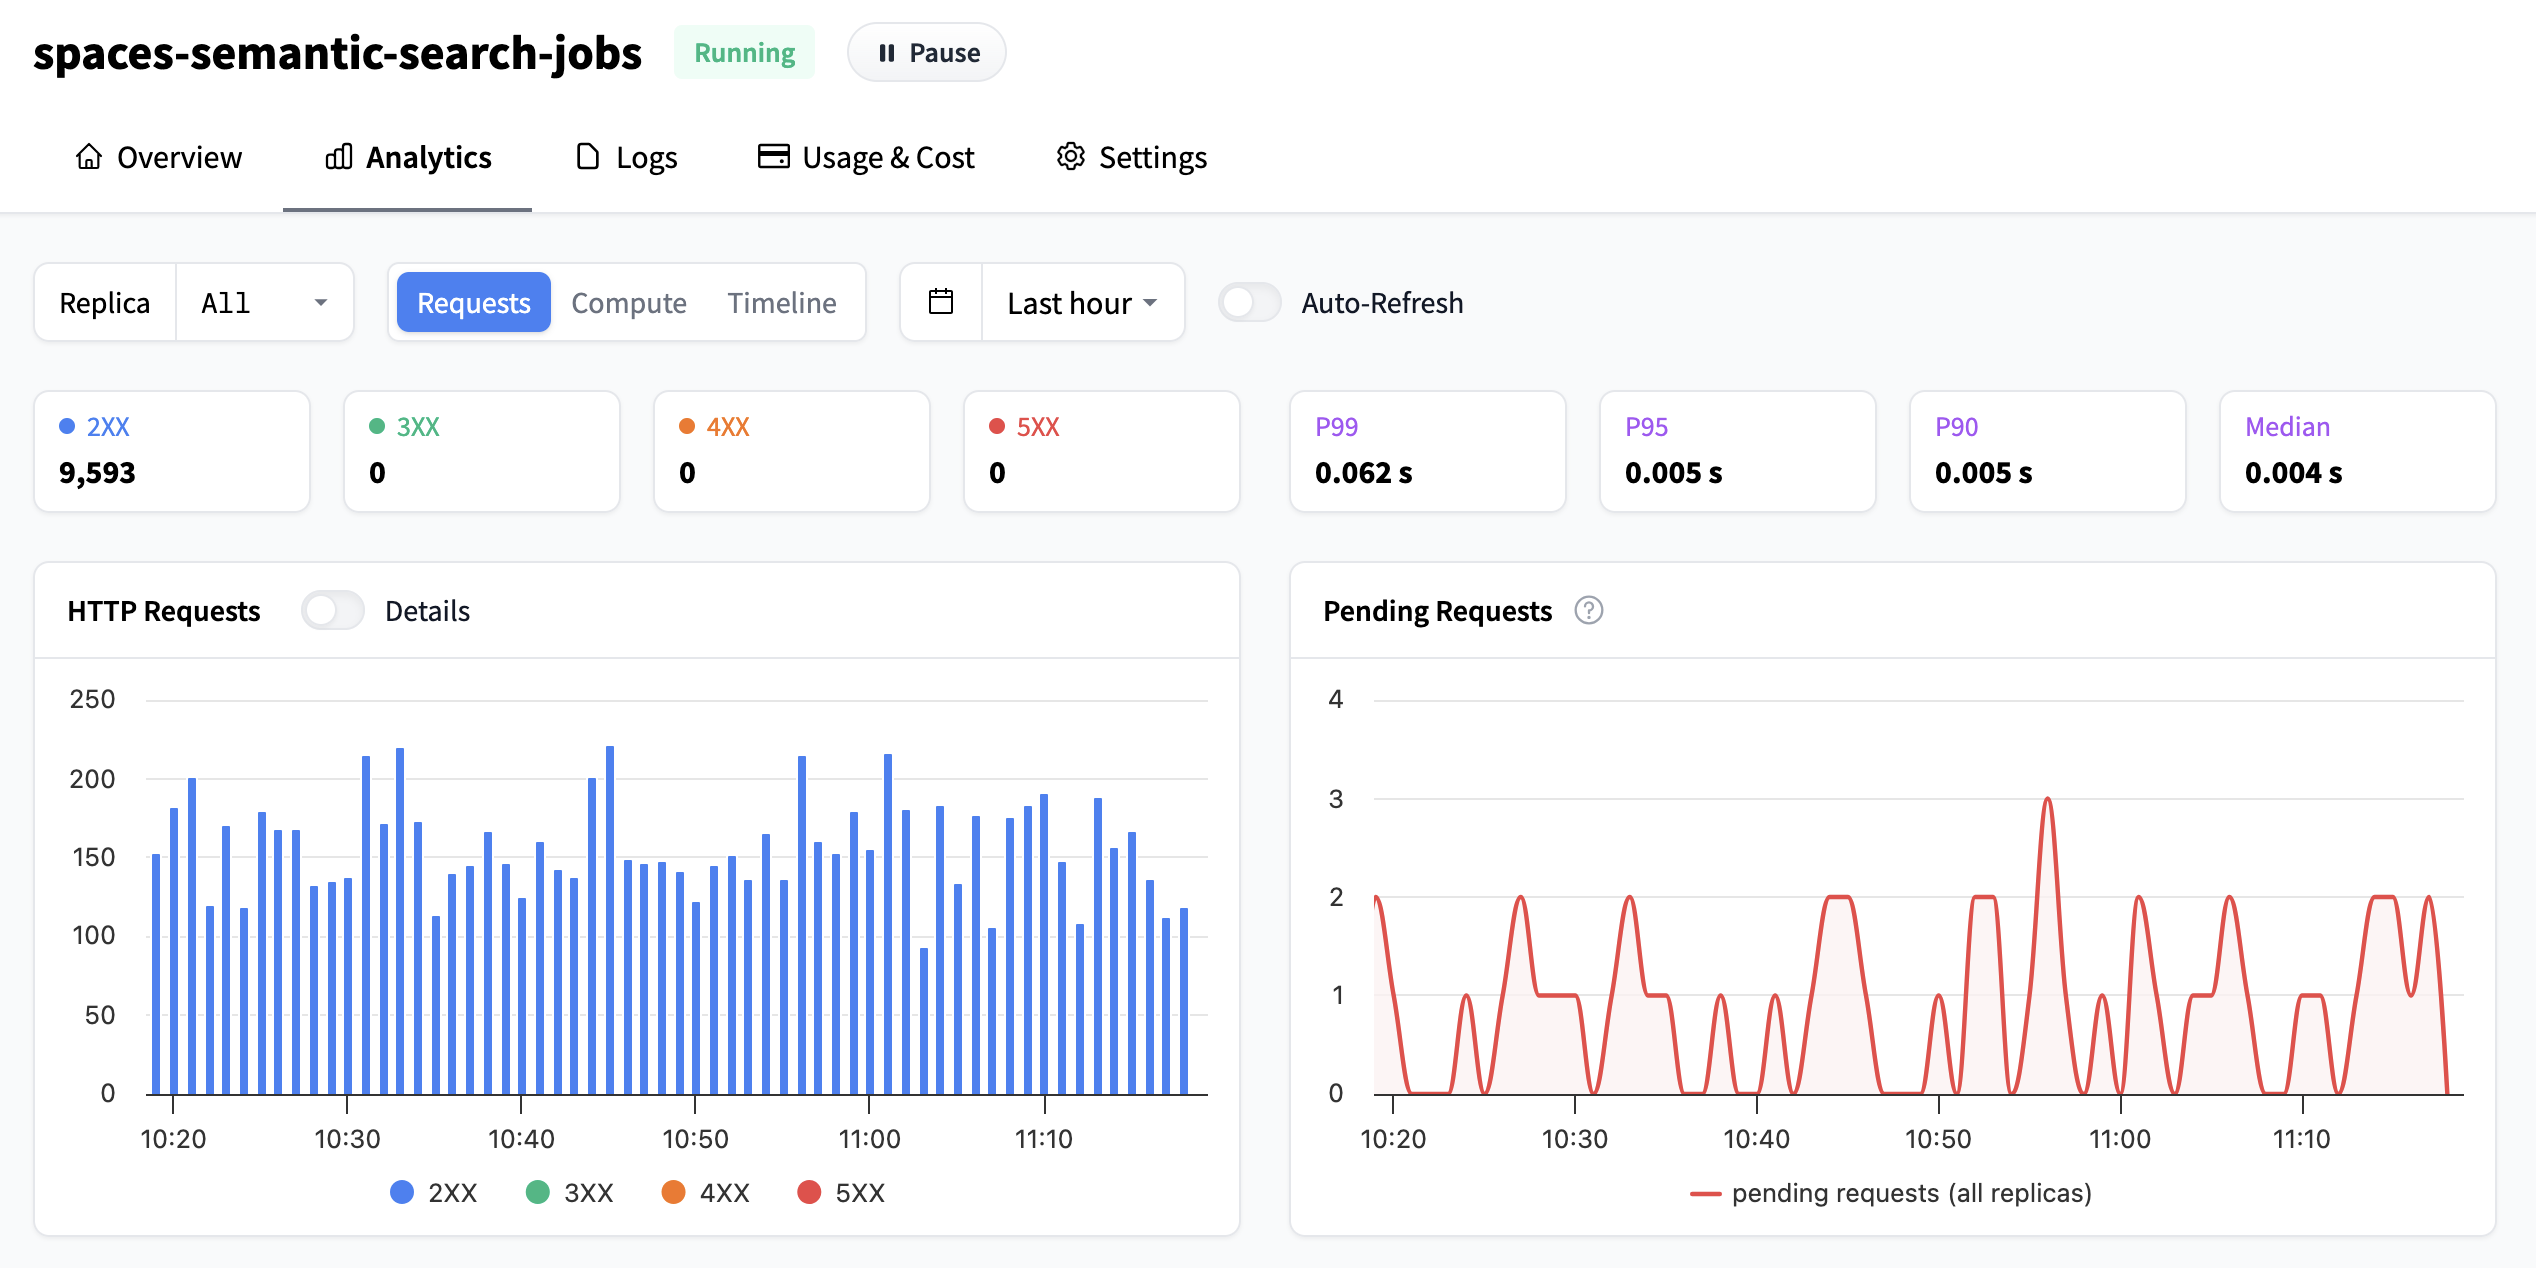 | |
| In the top bar, you can configure the high level view: | |
| - Which replica to view metrics from: either an individual replica or all. | |
| - If you want to view metrics related to requests, hardware, or timeline of replicas. | |
| - Which time frame you'll inspect the metrics, and this setting affects all graphs on the page. You can choose between any of the existing settings from the dropdown, or click-and-drag over any graph for a custom timeframe. You can also enable/disable | |
| auto refresh or view the metrics per replica or all. | |
|  | |
| ## Understanding the graphs | |
| ### Number of (HTTP) Requests | |
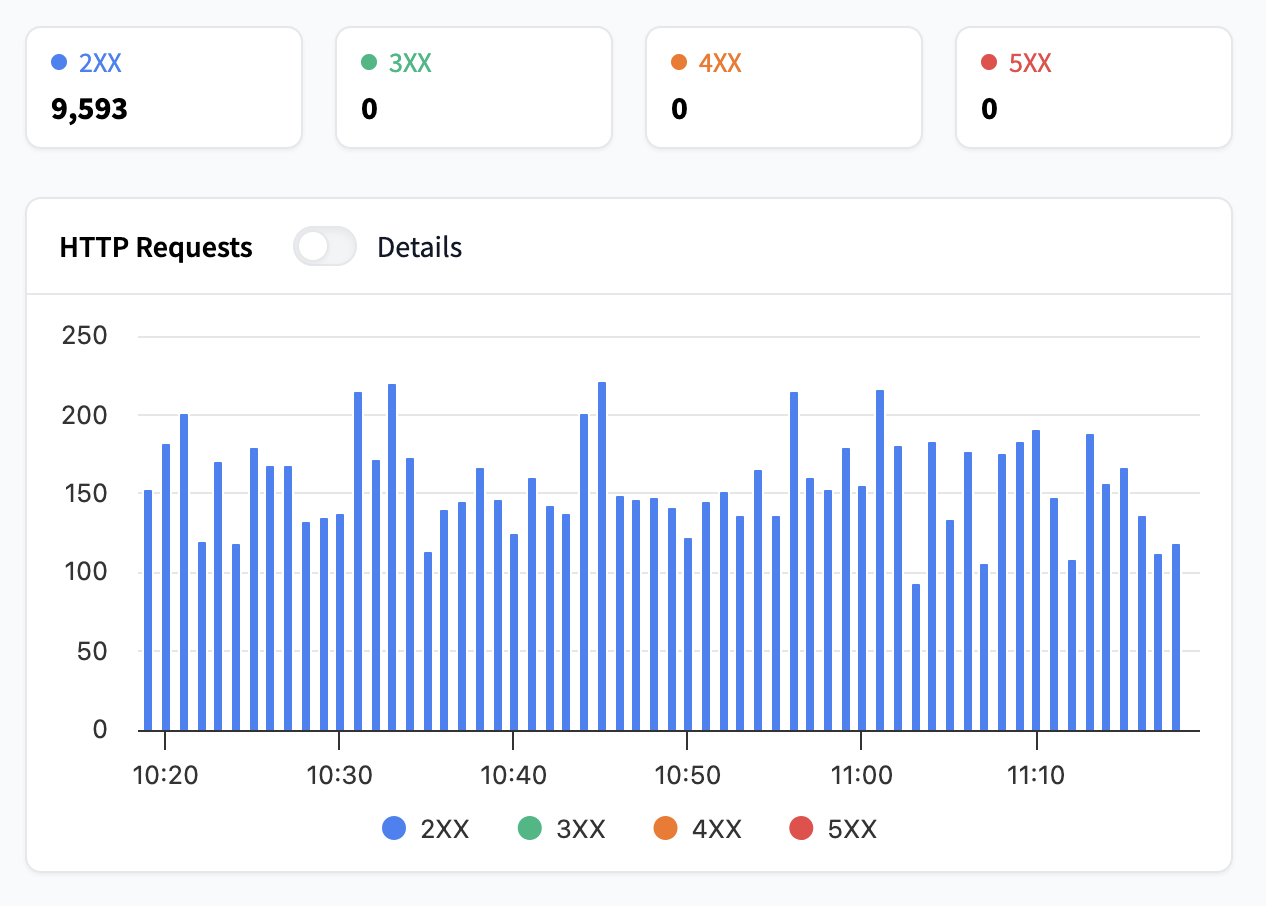
| The first graph at the top left shows you how many requests your Inference Endpoint has received. By default they are grouped by HTTP response | |
| classes, but by switching the toggle you can view them by individual status. As a reminder the HTTP response classes are: | |
| - **Informational responses (100-199)**: The server has received your request and is working on it. For example, `102 Processing` means the server is still handling your request. | |
| - **Successful responses (200-299)**: Your request was received and completed successfully. For example, `200 OK` means everything worked as expected. | |
| - **Redirection messages (300-399)**: The server is telling your client to look somewhere else for the information or to take another action. For example, `301 Moved Permanently` means the resource has a new address. | |
| - **Client error responses (400-499)**: There was a problem with the request sent by your client (like a typo in the URL or missing data). For example, `404 Not Found` means the server couldn't find what you asked for. | |
| - **Server error responses (500-599)**: The server ran into an issue while trying to process your request. For example, `502 Bad Gateway` means the server got an invalid response from another server it tried to contact. | |
| We recommend checking the [MDN web docs](https://developer.mozilla.org/en-US/docs/Web/HTTP/Reference/Status) for more information on individual | |
| status codes. | |
| The boxes above the graph also show the % of requests in the respective response class. | |
|  | |
| ### Pending Requests | |
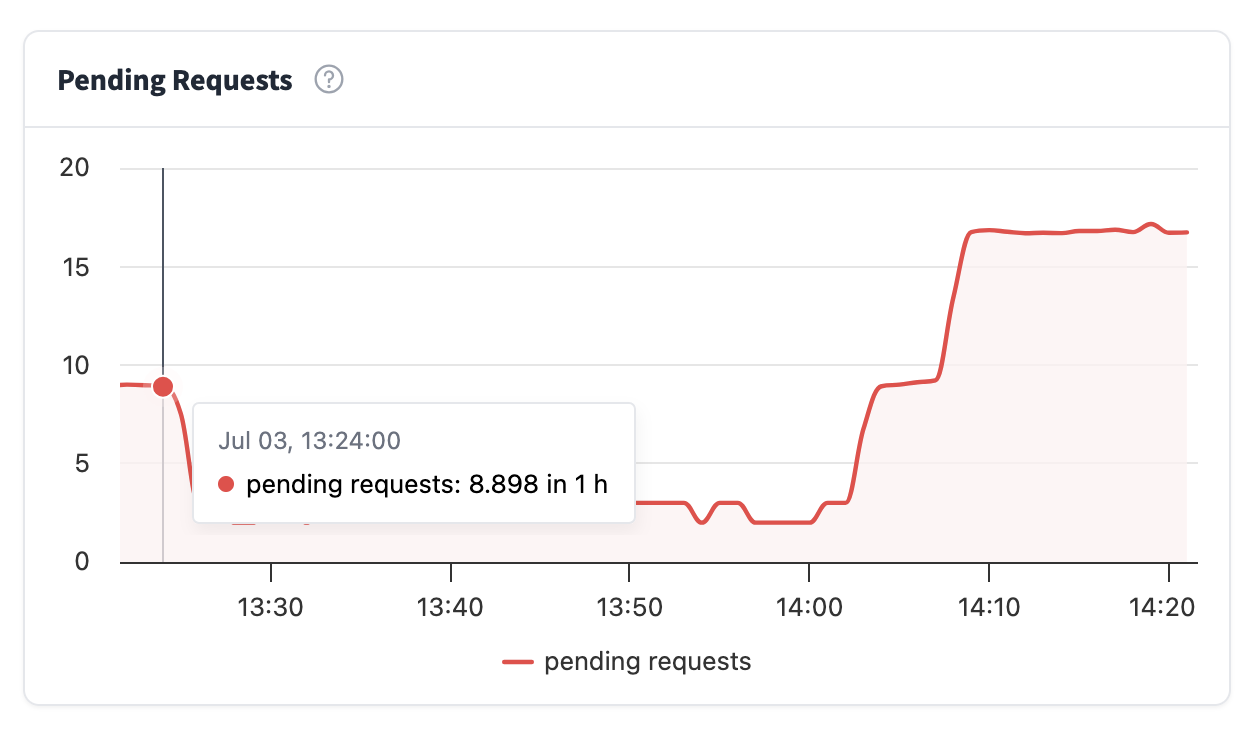
| Pending requests are requests that have not yet received an HTTP status, meaning they include in-flight requests and requests currently | |
| being processed. If this metric increases too much, it means that your requests are queuing up, and your users have to wait for requests | |
| to finish. In this case you should consider increasing your number of replicas or alternatively use autoscaling, you can read more about | |
| it in the [autoscaling guide](./autoscaling#scalingbasedonpendingrequests(betafeature)) | |
|  | |
| ### Latency Distribution | |
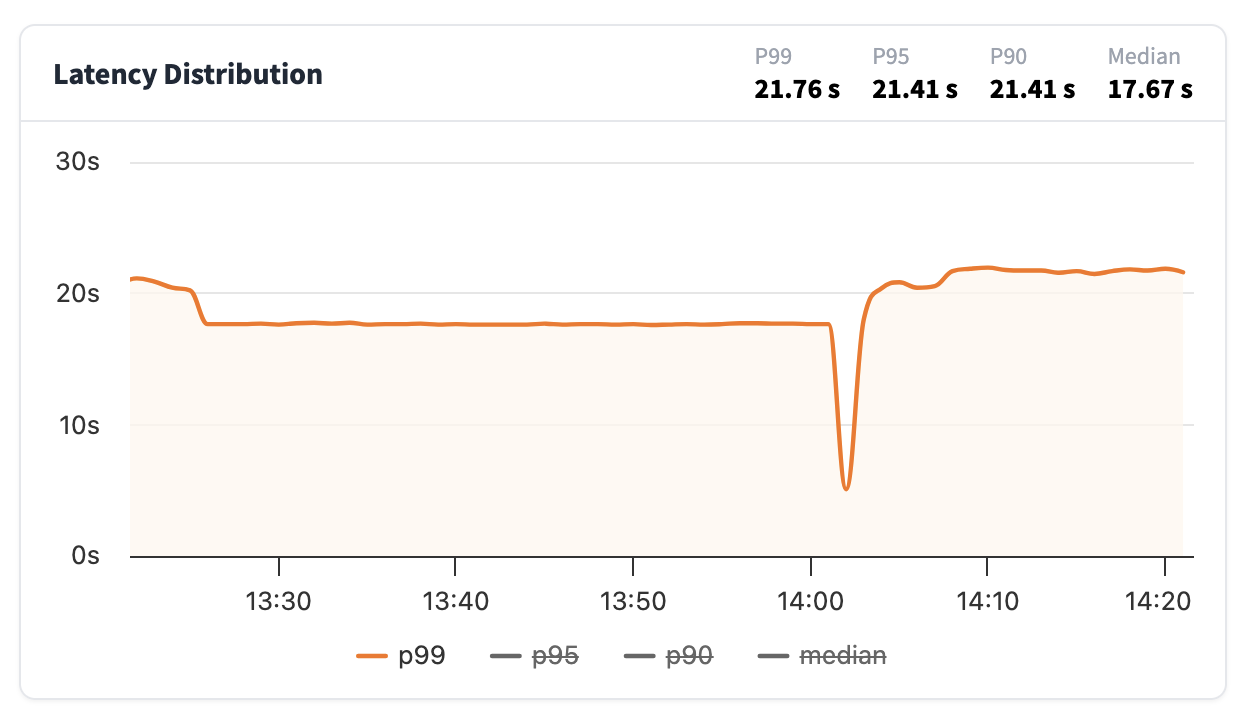
| From this graph you'll be able to see how long it takes for your Inference Endpoint to generate a response. Latency is reported as: | |
| - **p99**: meaning that 99% of all requests were faster than this value | |
| - **p95**: meaning that 95% of all requests were faster than this value | |
| - **p90**: meaning that 90% of all requests were faster than this value | |
| - **median**: meaning that 50% of all requests were faster than this value | |
| Usually a good metric is also to look at how big the difference is between the median and p99. The closer the values are to each other, the more | |
| uniform the latency is, whereas if the difference is large, it means that the users of your Inference Endpoint have in general a fast response but | |
| the worst case latencies can be long. | |
|  | |
| ### Running Replicas | |
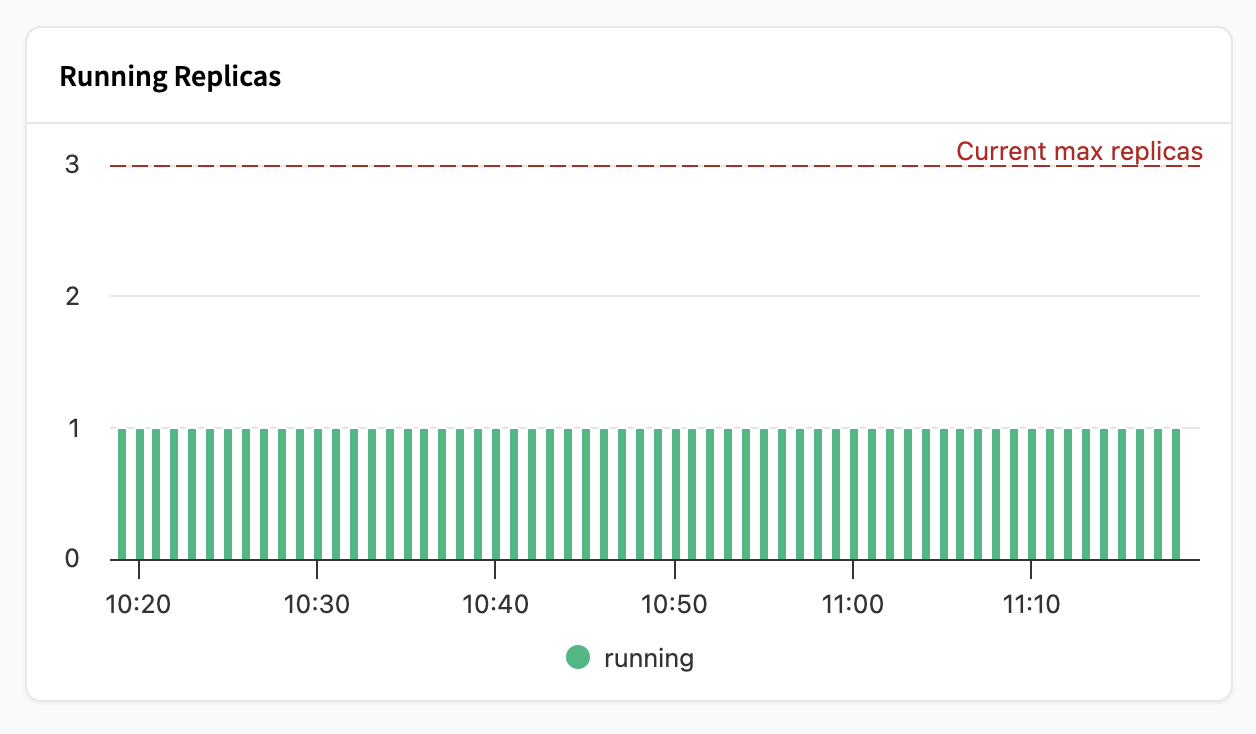
| In the running replica graph, you'll see how many running replicas you have during a point in time. The red line shows | |
| your current maximum replicas setting. | |
|  | |
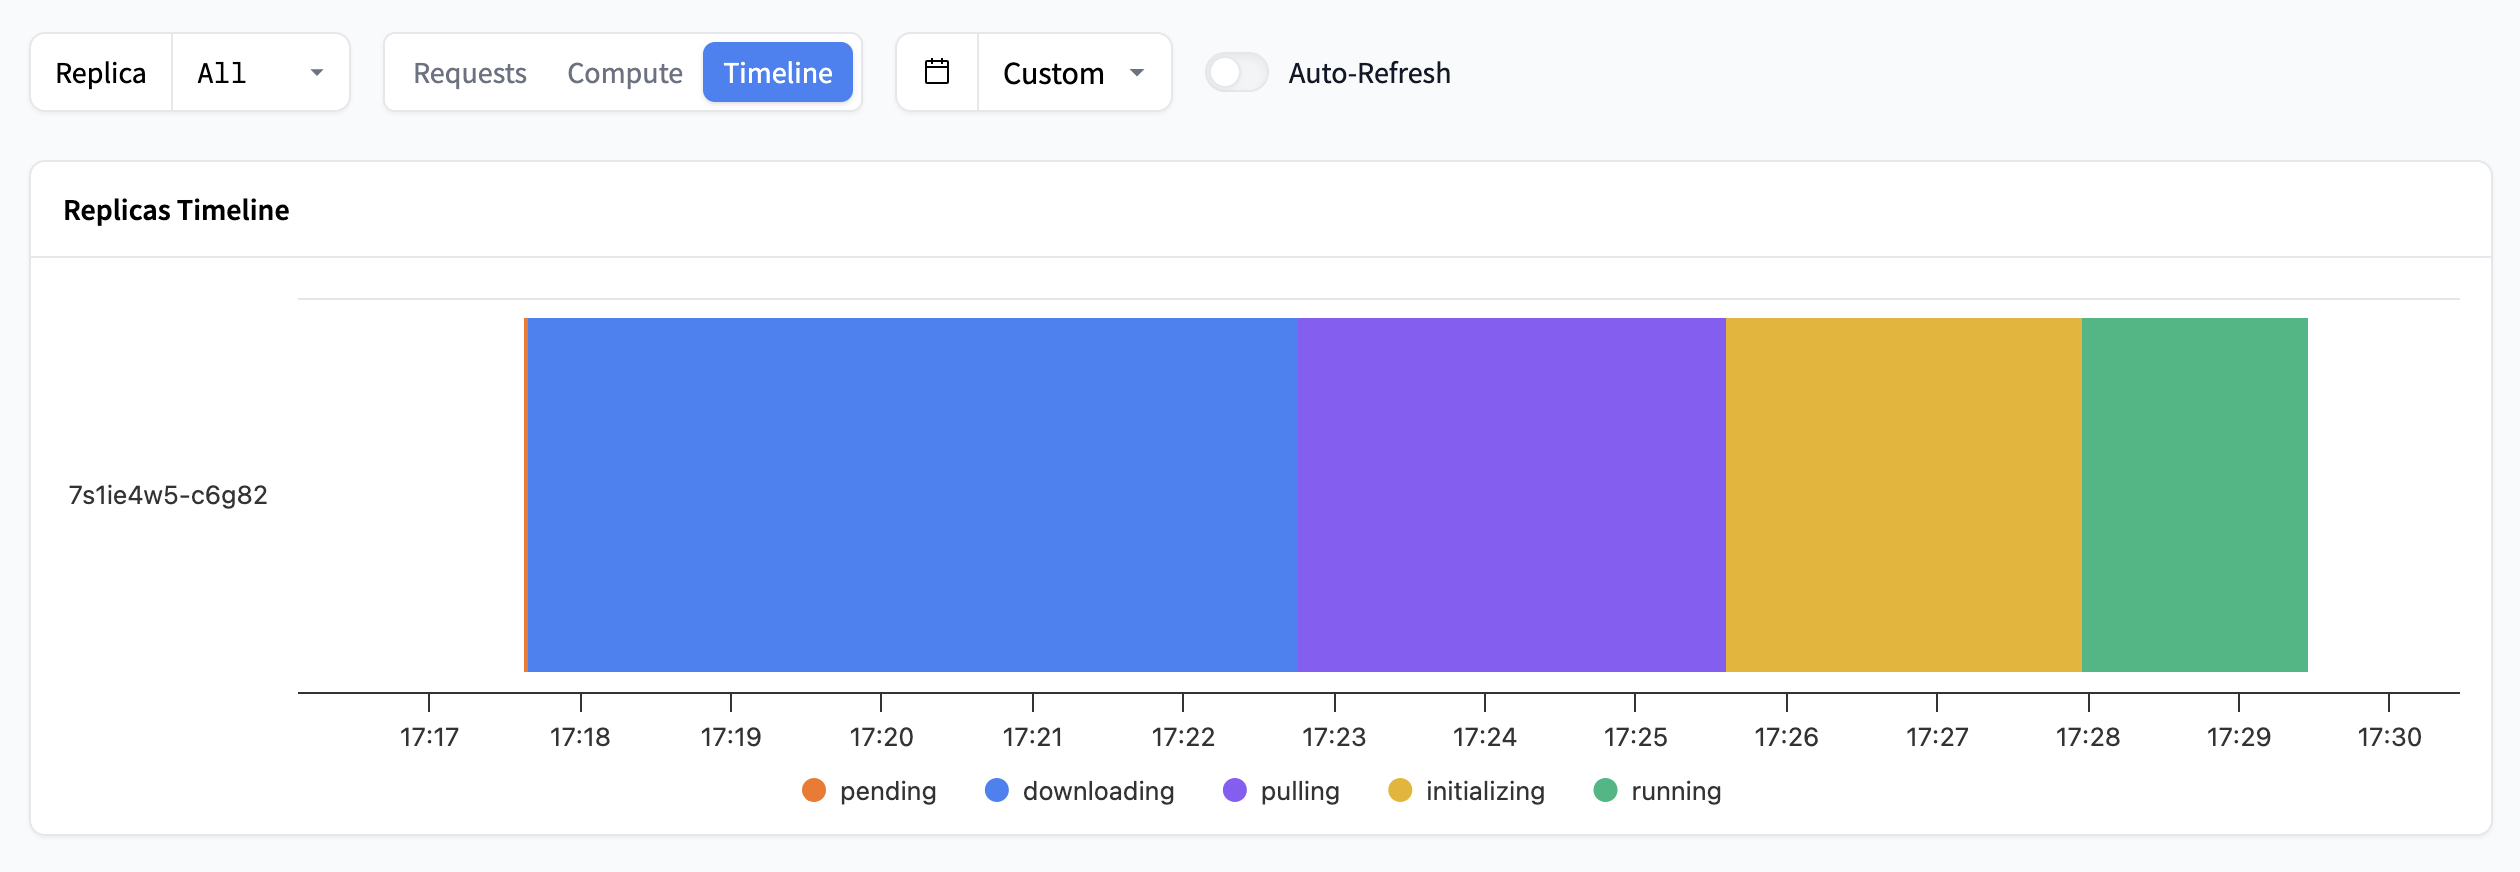
| For a more advanced view of different statuses for individual replicas, going from *pending* all the way | |
| to *running*, you can toggle to the Timeline section. This is very useful to get a sense of how long it takes an Endpoint to become ready to serve requests. | |
|  | |
| ### Compute | |
| These four graphs are dedicated to hardware usage. You'll find: | |
| - CPU usage: How much processing power is being used. | |
| - Memory usage: How much RAM is being used. | |
| - GPU usage: How much of the GPU's processing power is being used. | |
| - GPU Memory (VRAM) usage: How much GPU memory is being used. | |
| 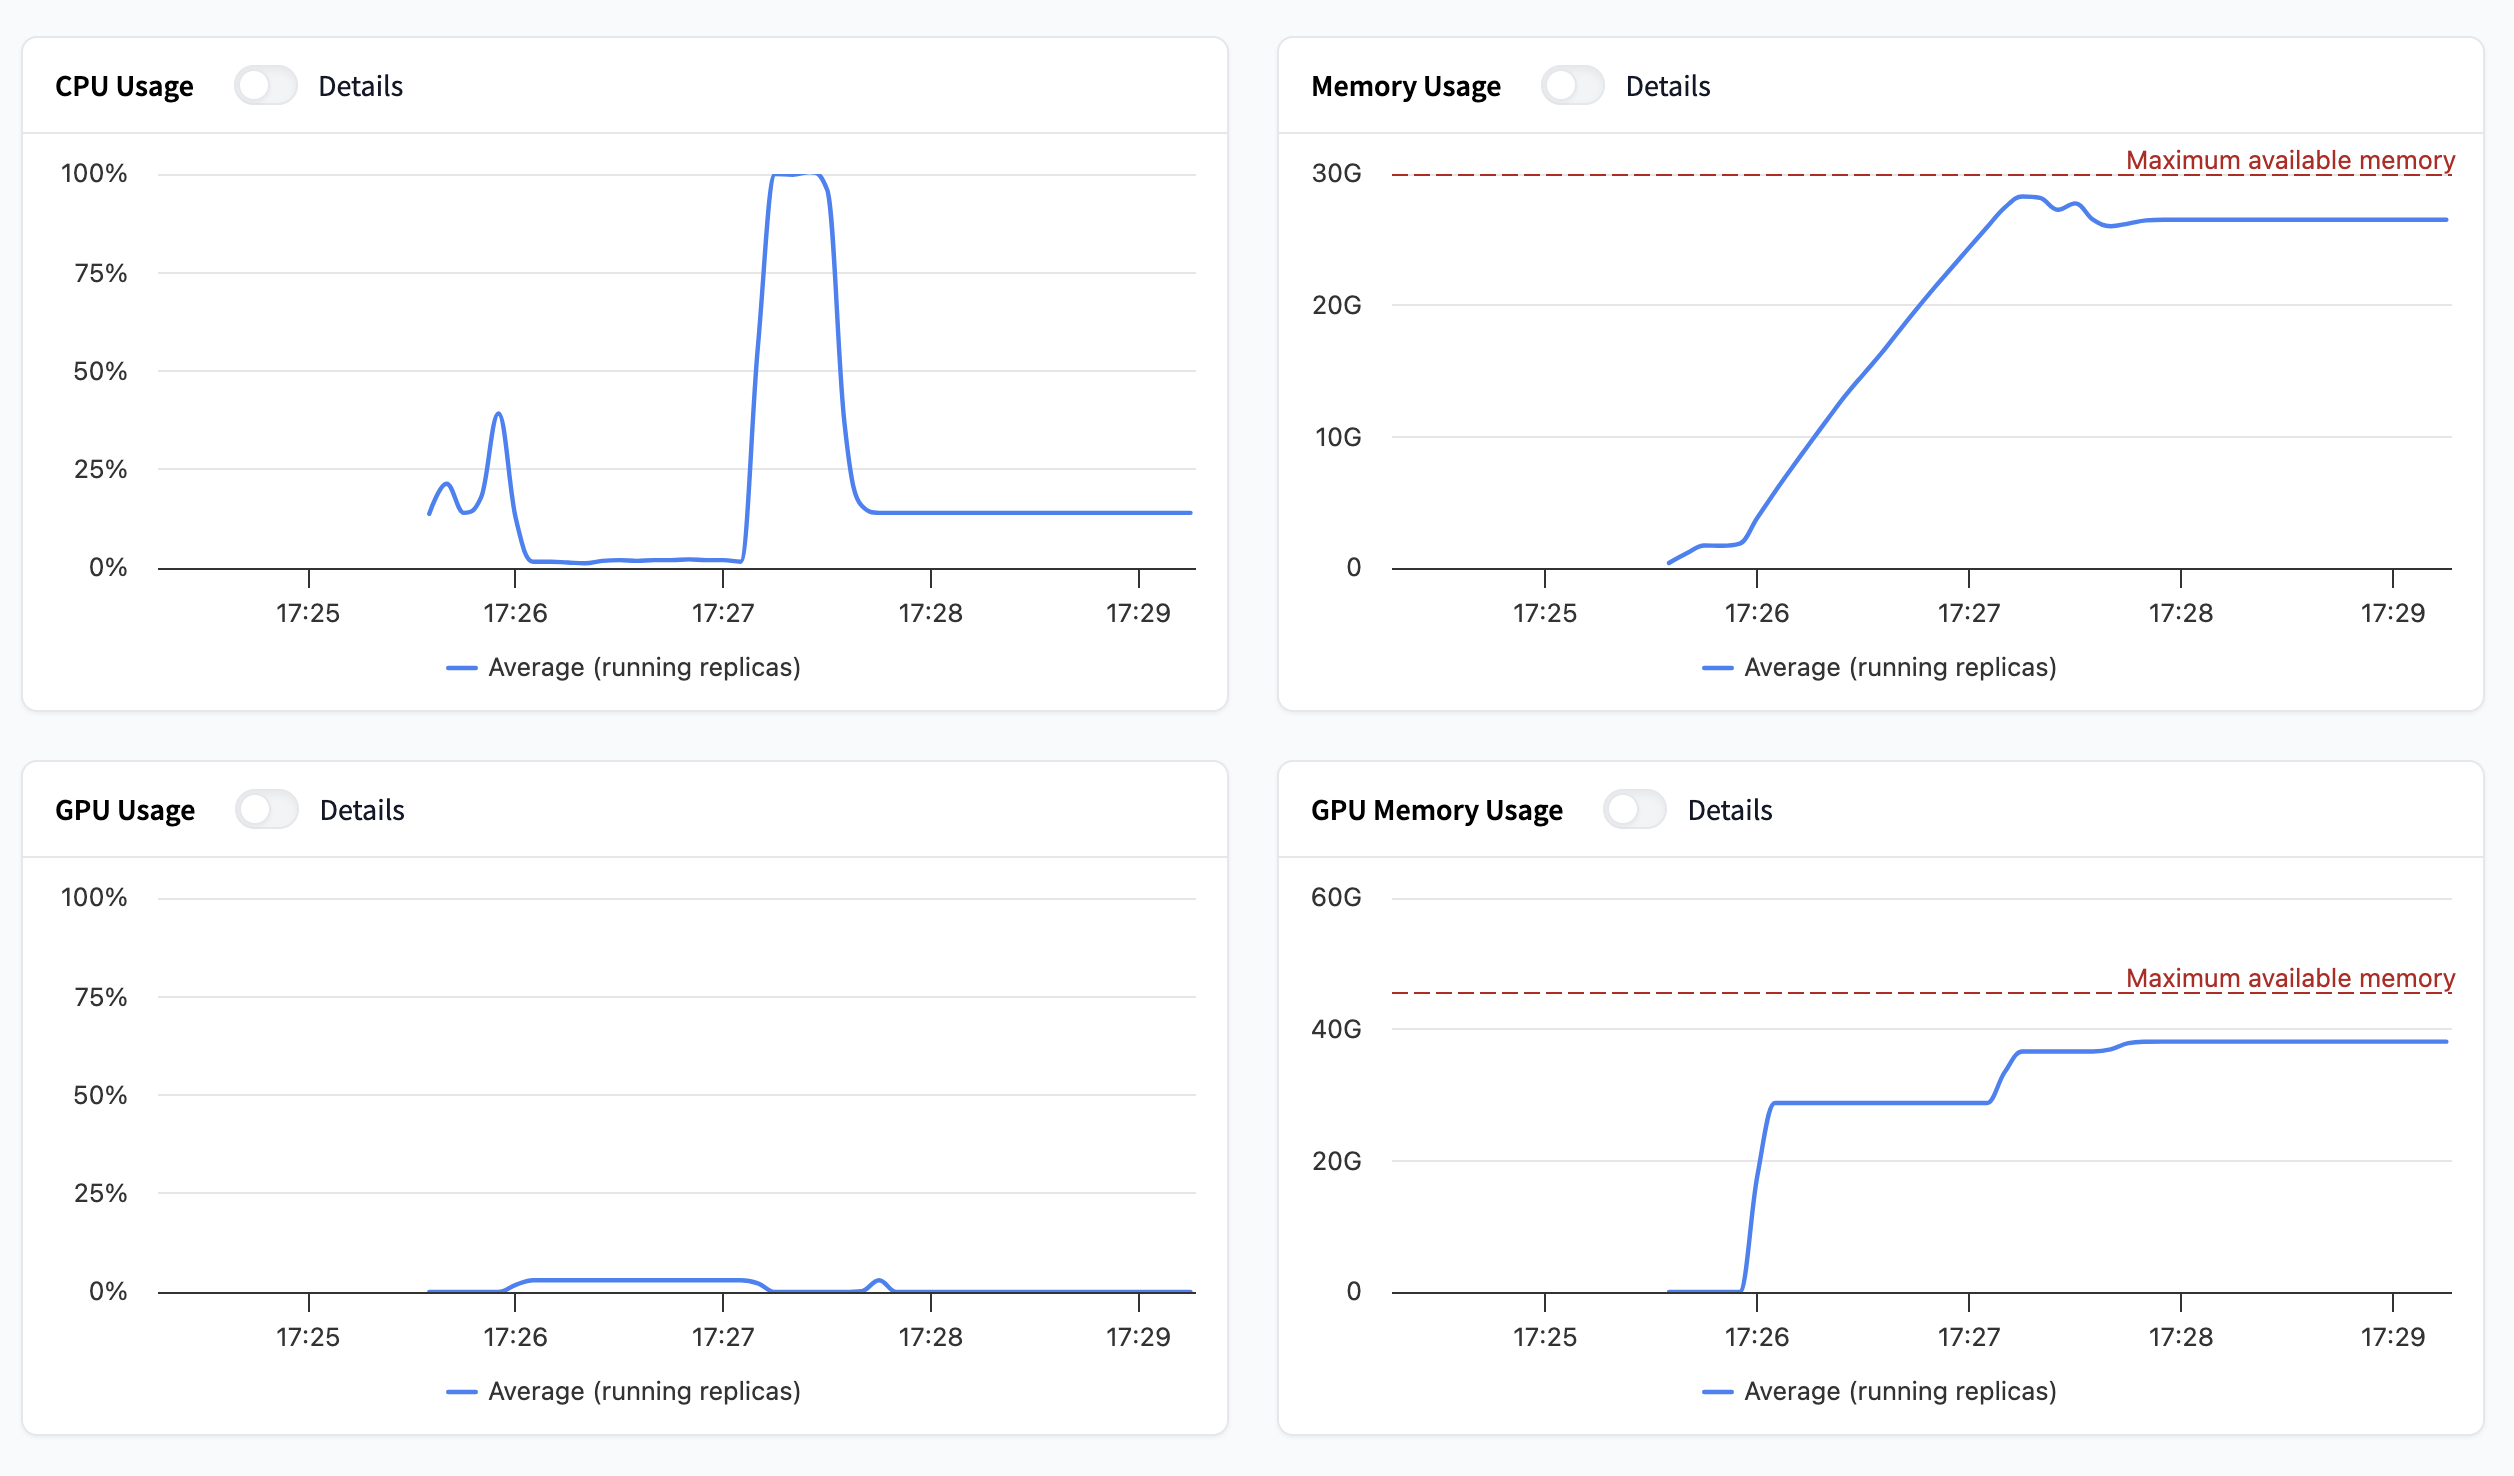 | |
| By toggling "details" you can either view the average or per replica value for the metric in question. | |
| If you have autoscaling based on hardware utilization enabled, these are the metrics that determine your autoscaling behaviour. You can | |
| read more about autoscaling [here](./autoscaling#scalingbasedonhardwareutilization) | |
| ## Create an integration with the Inference Endpoints Metrics API | |
| **This feature is currently in Beta. You will need to be subscribed to [Team or Enterprise](https://huggingface.co/pricing) to take advantage of this feature.** | |
| You have the ability to integrate the metrics of your Inference Endpoint(s) to your internal tool. | |
| Utilizing OpenMetrics, you can create an integration to allow for a more granular view of your Endpoint's metrics in almost-real-time, | |
| showing for example: | |
| - requests grouped by replica | |
| - latency distribution of requests | |
| - hardware metrics for all accelerator types | |
| OpenMetrics is a standardized format for representing and transmitting time series data, making it easier for systems to consume and | |
| process metrics, ensuring that the data is structured optimally for storage and transport. | |
| Further configurations and notifications can be set up for your Endpoints based on these metrics in your internal tool. | |
| ### Connect with your internal tool | |
| There are a variety of tools that work with OpenMetrics. You'll need to set up an agent. Here's some example docs to help get you started: | |
| - [Datadog](https://docs.datadoghq.com/integrations/openmetrics/) | |
| - [Grafana](https://tinyurl.com/e4fypk5m) | |
| ### Subscribe to Team or Enterprise | |
| Your organization can sign up for the Team or Enterprise plan [here](https://huggingface.co/enterprise?subscribe=true) 🚀 | |
| For any questions or feature requests, please email us at api-enterprise@huggingface.co | |
| <EditOnGithub source="https://github.com/huggingface/hf-endpoints-documentation/blob/main/docs/source/guides/analytics.md" /> | |
| <!--HF DOCBUILD BODY END--> | |
| HF_DOC_BODY_END | |
Xet Storage Details
- Size:
- 7.41 kB
- Xet hash:
- 6738a8851e61cc04bad6d28a662cbec1ace2cd19ce6ab807d8bc4a2df51270eb
·
Xet efficiently stores files, intelligently splitting them into unique chunks and accelerating uploads and downloads. More info.