Buckets:

Title: Dynamic Scaling of Unit Tests for Code Reward Modeling
URL Source: https://arxiv.org/html/2501.01054
Markdown Content: Zeyao Ma 1,3, Xiaokang Zhang 1,3 1 1 footnotemark: 1, Jing Zhang 1,3, Jifan Yu 2, Sijia Luo 1, Jie Tang 2
1 School of Information, Renmin University of China, 2 Tsinghua University,
3 Key Laboratory of Data Engineering and Knowledge Engineering, Beijing, China
zeyaoma@gmail.com, {zhang2718, zhang-jing}@ruc.edu.cn
https://code-reward-model.github.io
Abstract
Current large language models (LLMs) often struggle to produce accurate solutions on the first attempt for code generation. Prior research tackles this challenge by generating multiple candidate solutions and validating them with LLM-generated unit tests. The execution results of unit tests serve as reward signals to identify correct solutions. As LLMs always confidently make mistakes, these unit tests are not reliable, thereby diminishing the quality of reward signals. Motivated by the observation that scaling the number of solutions improves LLM performance, we explore the impact of scaling unit tests to enhance reward signal quality. Our pioneer experiment reveals a positive correlation between the number of unit tests and reward signal quality, with greater benefits observed in more challenging problems. Based on these insights, we propose CodeRM-8B, a lightweight yet effective unit test generator that enables efficient and high-quality unit test scaling. Additionally, we implement a dynamic scaling mechanism that adapts the number of unit tests based on problem difficulty, further improving efficiency. Experimental results show that our approach significantly improves performance across various models on three benchmarks (e.g., with gains of 18.43%percent 18.43 18.43%18.43 % for Llama3-8B and 3.42%percent 3.42 3.42%3.42 % for GPT-4o-mini on HumanEval Plus).
Dynamic Scaling of Unit Tests for Code Reward Modeling
Zeyao Ma 1,3††thanks: Equal Contributions.††thanks: Work was done when interned at Zhipu AI., Xiaokang Zhang 1,3 1 1 footnotemark: 1, Jing Zhang 1,3††thanks: Corresponding Author., Jifan Yu 2, Sijia Luo 1, Jie Tang 2 1 School of Information, Renmin University of China, 2 Tsinghua University,3 Key Laboratory of Data Engineering and Knowledge Engineering, Beijing, China zeyaoma@gmail.com, {zhang2718, zhang-jing}@ruc.edu.cnhttps://code-reward-model.github.io
1 Introduction
Code generation aims to automatically produce code solutions that satisfy programming requirements specified in natural language(Svyatkovskiy et al., 2020). Recent advancements in large language models (LLMs) have shown significant progress in this domain(Touvron et al., 2023; Achiam et al., 2023). However, generating correct code on the first attempt remains challenging due to the inherent complexity of reasoning required(Li et al., 2022; Huang et al., 2024b). Beyond developing more powerful LLMs, some research leverages additional test-time computation to generate more code solutions via repeated sampling, while a verifier or reward model reranks and identifies the optimal solution(Inala et al., 2022; Chen et al., 2023). Although repeated sampling enables LLMs to produce correct solutions(Chen et al., 2021; Brown et al., 2024), identifying the correct solution from the multitude of candidates poses a significant challenge(Gao et al., 2023).
Unit tests (i.e., pairs of input and expected output) are frequently used as verifers to identify correct code solutions(Shi et al., 2022; Chen et al., 2023). Specifically, LLMs generate unit tests based on the given instructions and candidate code solutions, which are then executed by a compiler or interpreter. The execution results serve as reward signals to identify correct solutions. However, as LLMs often confidently make mistakes(Huang et al., 2024c), the reliability of these unit tests is not guaranteed, thereby diminishing the quality of the reward signal. Inspired by the performance gains from scaling test-time computation to generate more responses(Snell et al., 2024), we ask: Can generating more unit tests improve the quality of the reward signal for code solutions?
To address this question, we conduct a pioneer experiment to investigate the correlation between the number of unit tests and the quality of the code reward signal across different LLMs, code solution quantities, and unit test scales. Our findings reveal:
- •Scaling the number of unit tests consistently improves the accuracy of identifying correct solutions across different model sizes and code solution quantities.
- •The benefits of scaling unit tests depend on problem difficulty, with more computational resources yielding greater improvements for challenging problems.
Building on these observations, we develop CodeRM-8B, a small yet powerful unit test generator designed to facilitate efficient and high-quality unit test scaling. To support model training, we introduce an automatic data synthetic pipeline that produces high-quality unit tests from existing code instruction-tuning datasets. Leveraging this synthesized data, we perform supervised fine-tuning (SFT) on Llama3.1-8B, resulting in a high-quality unit test generation model. Furthermore, since the benefits of scaling unit tests vary with problem difficulty, we follow Damani et al. (2024) to implement the dynamic unit test scaling on different problems. Specifically, we train a lightweight problem difficulty classifier using the language model probing method(Alain and Bengio, 2017; Kadavath et al., 2022), which extracts implicit information from the LLM’s intermediate representation and outputs a scalar problem difficulty. Based on this classifier, we dynamically allocate computation budgets across problems of varying difficulties using a greedy algorithm(Edmonds, 1971).
We conduct extensive experiments to evaluate the effectiveness of CodeRM-8B on three widely used benchmarks and four LLMs with varying parameter scales for solution generation. The results demonstrate that scaling unit tests with CodeRM-8B significantly improves the performance of smaller models (e.g., a performance gain of 18.43%percent 18.43 18.43%18.43 % on HumanEval Plus for Llama3-8B). Moreover, CodeRM-8B enhances the performance of significantly larger models or even proprietary models (e.g., a 4.95%percent 4.95 4.95%4.95 % gain for Llama3-70B and 3.42%percent 3.42 3.42%3.42 % for GPT-4o-mini on HumanEval Plus). We also evaluate the performance of dynamic unit test scaling on two benchmarks. By leveraging a trained problem difficulty classifier and dynamically allocating computation budgets, this approach brings additional performance improvements at a fixed computational cost (e.g., up to approximately 0.5%percent 0.5 0.5%0.5 % performance gain on MBPP Plus).
The main contributions of this paper are as follows: 1) A pioneer experiment revealing a positive correlation between the number of unit tests and the quality of the code reward signal, with greater benefits for more challenging problems as unit test scales. 2) A small yet powerful model enabling efficient and high-quality unit test scaling. 3) An implementation of dynamic unit test scaling over problems in different difficulties. 4) Experimental results validating the effectiveness of CodeRM-8B and the implementation of dynamic scaling.
2 Pioneer Experiment
This section explores the correlation between the quantity of LLM-generated unit tests and the quality of the code reward signal. We first present the methodology, including a unit test-based majority voting framework and the setup of the pioneer experiment. Subsequently, we analyze the observations derived from the pioneer results.
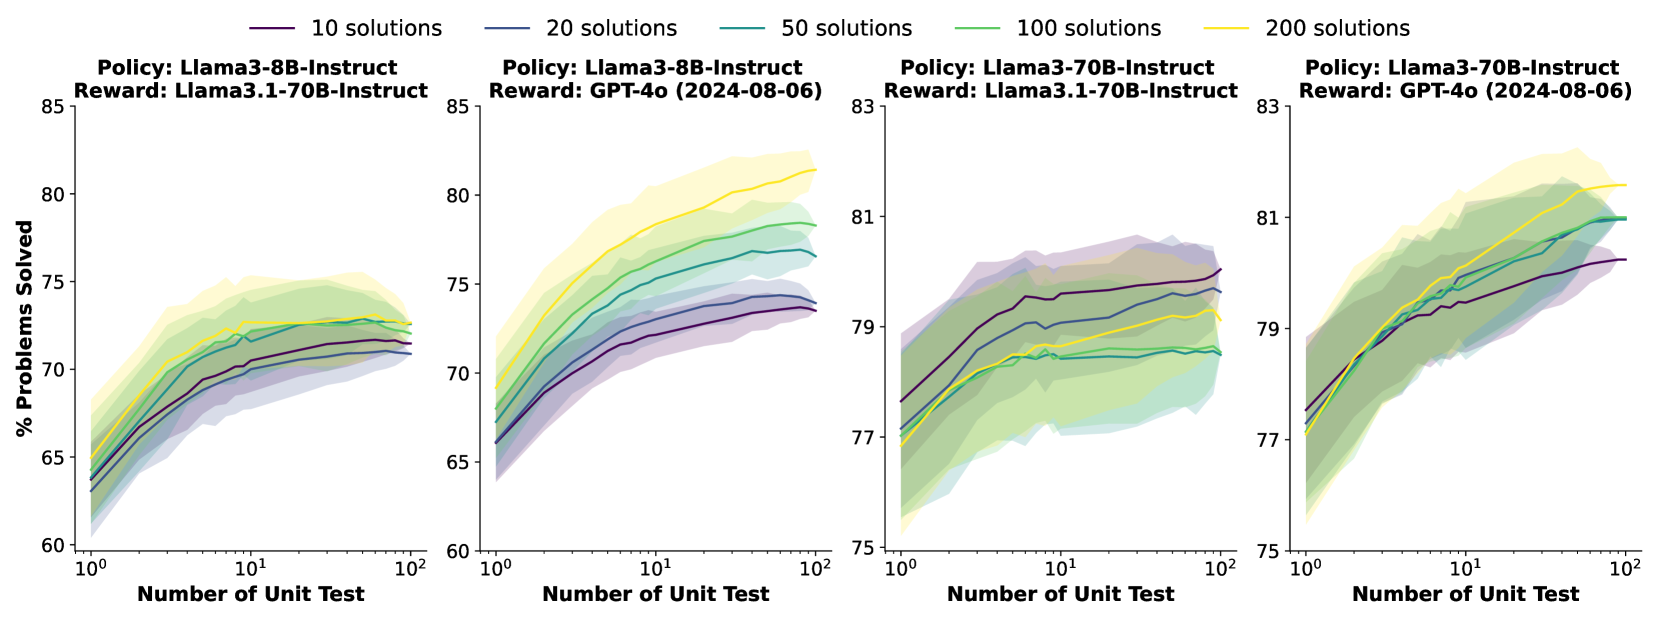
Figure 1: Scaling the quantities of unit tests for majority voting leads to improvements in performance across different policy models and reward models. Policy refers to the model that produces code solutions, while reward denotes the model that generates unit tests.
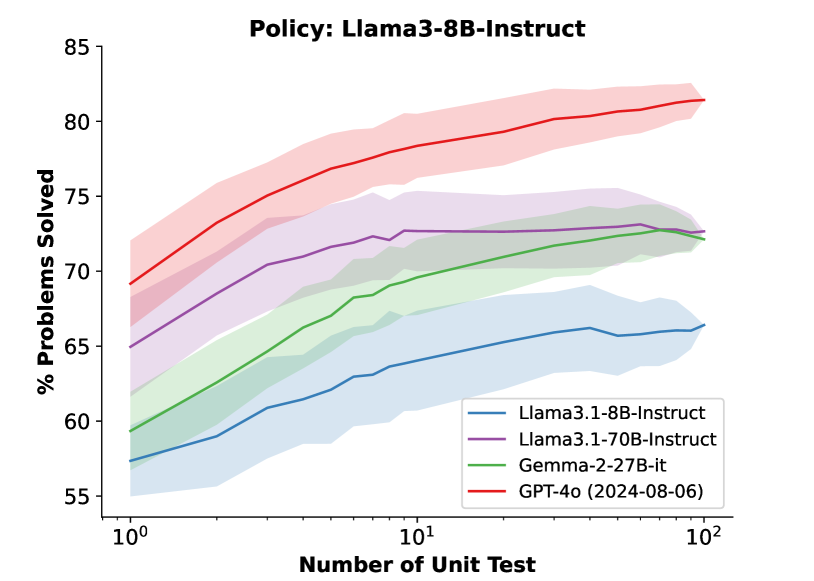
Figure 2: The correlation between the quantities of unit tests and the performance on different unit test generators (reward model) with 200 200 200 200 candidate code solutions.
2.1 Methodology
The unit test-based majority voting framework follows a standard best-of-N strategy(Cobbe et al., 2021; Lightman et al., 2024). Given a programming question Q 𝑄 Q italic_Q, the policy model generates N 𝑁 N italic_N candidate code solutions:
{C 1,C 2,…,C N},subscript 𝐶 1 subscript 𝐶 2…subscript 𝐶 𝑁{C_{1},C_{2},\dots,C_{N}},{ italic_C start_POSTSUBSCRIPT 1 end_POSTSUBSCRIPT , italic_C start_POSTSUBSCRIPT 2 end_POSTSUBSCRIPT , … , italic_C start_POSTSUBSCRIPT italic_N end_POSTSUBSCRIPT } ,
where C i subscript 𝐶 𝑖 C_{i}italic_C start_POSTSUBSCRIPT italic_i end_POSTSUBSCRIPT represents the i 𝑖 i italic_i-th candidate solution. Based on the programming question and the candidate code solution, an auxiliary LLM generates M 𝑀 M italic_M unit tests:
{T 1,T 2,…,T M}subscript 𝑇 1 subscript 𝑇 2…subscript 𝑇 𝑀{T_{1},T_{2},\dots,T_{M}}{ italic_T start_POSTSUBSCRIPT 1 end_POSTSUBSCRIPT , italic_T start_POSTSUBSCRIPT 2 end_POSTSUBSCRIPT , … , italic_T start_POSTSUBSCRIPT italic_M end_POSTSUBSCRIPT }
Each unit test T j subscript 𝑇 𝑗 T_{j}italic_T start_POSTSUBSCRIPT italic_j end_POSTSUBSCRIPT consists of a set of test cases:
T j={(x j,1,y j,1),(x j,2,y j,2),…,(x j,K j,y j,K j)},subscript 𝑇 𝑗 subscript 𝑥 𝑗 1 subscript 𝑦 𝑗 1 subscript 𝑥 𝑗 2 subscript 𝑦 𝑗 2…subscript 𝑥 𝑗 subscript 𝐾 𝑗 subscript 𝑦 𝑗 subscript 𝐾 𝑗 T_{j}={(x_{j,1},y_{j,1}),(x_{j,2},y_{j,2}),\dots,!(x_{j,K_{j}},y_{j,K_{j}})},italic_T start_POSTSUBSCRIPT italic_j end_POSTSUBSCRIPT = { ( italic_x start_POSTSUBSCRIPT italic_j , 1 end_POSTSUBSCRIPT , italic_y start_POSTSUBSCRIPT italic_j , 1 end_POSTSUBSCRIPT ) , ( italic_x start_POSTSUBSCRIPT italic_j , 2 end_POSTSUBSCRIPT , italic_y start_POSTSUBSCRIPT italic_j , 2 end_POSTSUBSCRIPT ) , … , ( italic_x start_POSTSUBSCRIPT italic_j , italic_K start_POSTSUBSCRIPT italic_j end_POSTSUBSCRIPT end_POSTSUBSCRIPT , italic_y start_POSTSUBSCRIPT italic_j , italic_K start_POSTSUBSCRIPT italic_j end_POSTSUBSCRIPT end_POSTSUBSCRIPT ) } ,
where x j,k subscript 𝑥 𝑗 𝑘 x_{j,k}italic_x start_POSTSUBSCRIPT italic_j , italic_k end_POSTSUBSCRIPT is the input for the k 𝑘 k italic_k-th test case in T j subscript 𝑇 𝑗 T_{j}italic_T start_POSTSUBSCRIPT italic_j end_POSTSUBSCRIPT, and y j,k subscript 𝑦 𝑗 𝑘 y_{j,k}italic_y start_POSTSUBSCRIPT italic_j , italic_k end_POSTSUBSCRIPT is the corresponding expected output. K j subscript 𝐾 𝑗 K_{j}italic_K start_POSTSUBSCRIPT italic_j end_POSTSUBSCRIPT represents the number of test cases in T j subscript 𝑇 𝑗 T_{j}italic_T start_POSTSUBSCRIPT italic_j end_POSTSUBSCRIPT. Each candidate solution C i subscript 𝐶 𝑖 C_{i}italic_C start_POSTSUBSCRIPT italic_i end_POSTSUBSCRIPT is executed on the unit tests {T 1,T 2,…,T M}subscript 𝑇 1 subscript 𝑇 2…subscript 𝑇 𝑀{T_{1},T_{2},\dots,T_{M}}{ italic_T start_POSTSUBSCRIPT 1 end_POSTSUBSCRIPT , italic_T start_POSTSUBSCRIPT 2 end_POSTSUBSCRIPT , … , italic_T start_POSTSUBSCRIPT italic_M end_POSTSUBSCRIPT }. For a given unit test T j subscript 𝑇 𝑗 T_{j}italic_T start_POSTSUBSCRIPT italic_j end_POSTSUBSCRIPT, the execution of C i subscript 𝐶 𝑖 C_{i}italic_C start_POSTSUBSCRIPT italic_i end_POSTSUBSCRIPT produces a binary result:
r i,j={1,if C i passes all test cases in T j;0,otherwise.subscript 𝑟 𝑖 𝑗 cases 1 if C i passes all test cases in T j 0 otherwise r_{i,j}=\begin{cases}1,&\text{if $C_{i}$ passes all test cases in $T_{j}$};\ 0,&\text{otherwise}.\end{cases}italic_r start_POSTSUBSCRIPT italic_i , italic_j end_POSTSUBSCRIPT = { start_ROW start_CELL 1 , end_CELL start_CELL if italic_C start_POSTSUBSCRIPT italic_i end_POSTSUBSCRIPT passes all test cases in italic_T start_POSTSUBSCRIPT italic_j end_POSTSUBSCRIPT ; end_CELL end_ROW start_ROW start_CELL 0 , end_CELL start_CELL otherwise . end_CELL end_ROW
The binary results for all unit tests form a reward signal for each candidate solution:
𝐑 i={r i,1,r i,2,…,r i,M}.subscript 𝐑 𝑖 subscript 𝑟 𝑖 1 subscript 𝑟 𝑖 2…subscript 𝑟 𝑖 𝑀\mathbf{R}{i}={r{i,1},r_{i,2},\dots,r_{i,M}}.bold_R start_POSTSUBSCRIPT italic_i end_POSTSUBSCRIPT = { italic_r start_POSTSUBSCRIPT italic_i , 1 end_POSTSUBSCRIPT , italic_r start_POSTSUBSCRIPT italic_i , 2 end_POSTSUBSCRIPT , … , italic_r start_POSTSUBSCRIPT italic_i , italic_M end_POSTSUBSCRIPT } .
Finally, we select the optimal candidate solution C opt subscript 𝐶 opt C_{\text{opt}}italic_C start_POSTSUBSCRIPT opt end_POSTSUBSCRIPT based on majority voting(Wang et al., 2023). This voting process determines C opt subscript 𝐶 opt C_{\text{opt}}italic_C start_POSTSUBSCRIPT opt end_POSTSUBSCRIPT as the solution that passes the maximum number of unit tests:
C opt=argmax C i∑j=1 M r i,j.subscript 𝐶 opt subscript 𝐶 𝑖 argmax superscript subscript 𝑗 1 𝑀 subscript 𝑟 𝑖 𝑗 C_{\text{opt}}=\underset{C_{i}}{\mathrm{argmax}}\sum_{j=1}^{M}r_{i,j}.italic_C start_POSTSUBSCRIPT opt end_POSTSUBSCRIPT = start_UNDERACCENT italic_C start_POSTSUBSCRIPT italic_i end_POSTSUBSCRIPT end_UNDERACCENT start_ARG roman_argmax end_ARG ∑ start_POSTSUBSCRIPT italic_j = 1 end_POSTSUBSCRIPT start_POSTSUPERSCRIPT italic_M end_POSTSUPERSCRIPT italic_r start_POSTSUBSCRIPT italic_i , italic_j end_POSTSUBSCRIPT .(1)
We utilize HumanEval Plus(Liu et al., 2023), a widely adopted dataset comprising handwritten Python programming questions with comprehensive unit tests. For each question, an LLM (policy model) generates N=200 𝑁 200 N=200 italic_N = 200 code solutions, while another LLM (reward model) produces M=100 𝑀 100 M=100 italic_M = 100 unit tests for supervision. The optimal solution is selected using Equation(1) and validated against the ground truth unit tests in the dataset. To compute the results for n 𝑛 n italic_n solutions (0≤n≤N 0 𝑛 𝑁 0\leq n\leq N 0 ≤ italic_n ≤ italic_N) and m 𝑚 m italic_m unit tests (0≤m≤M 0 𝑚 𝑀 0\leq m\leq M 0 ≤ italic_m ≤ italic_M), we employ the bootstrap resampling method(Efron, 1979), generating 100 100 100 100 bootstrap samples to compute mean values and confidence intervals, as shown in Figure1 and2.
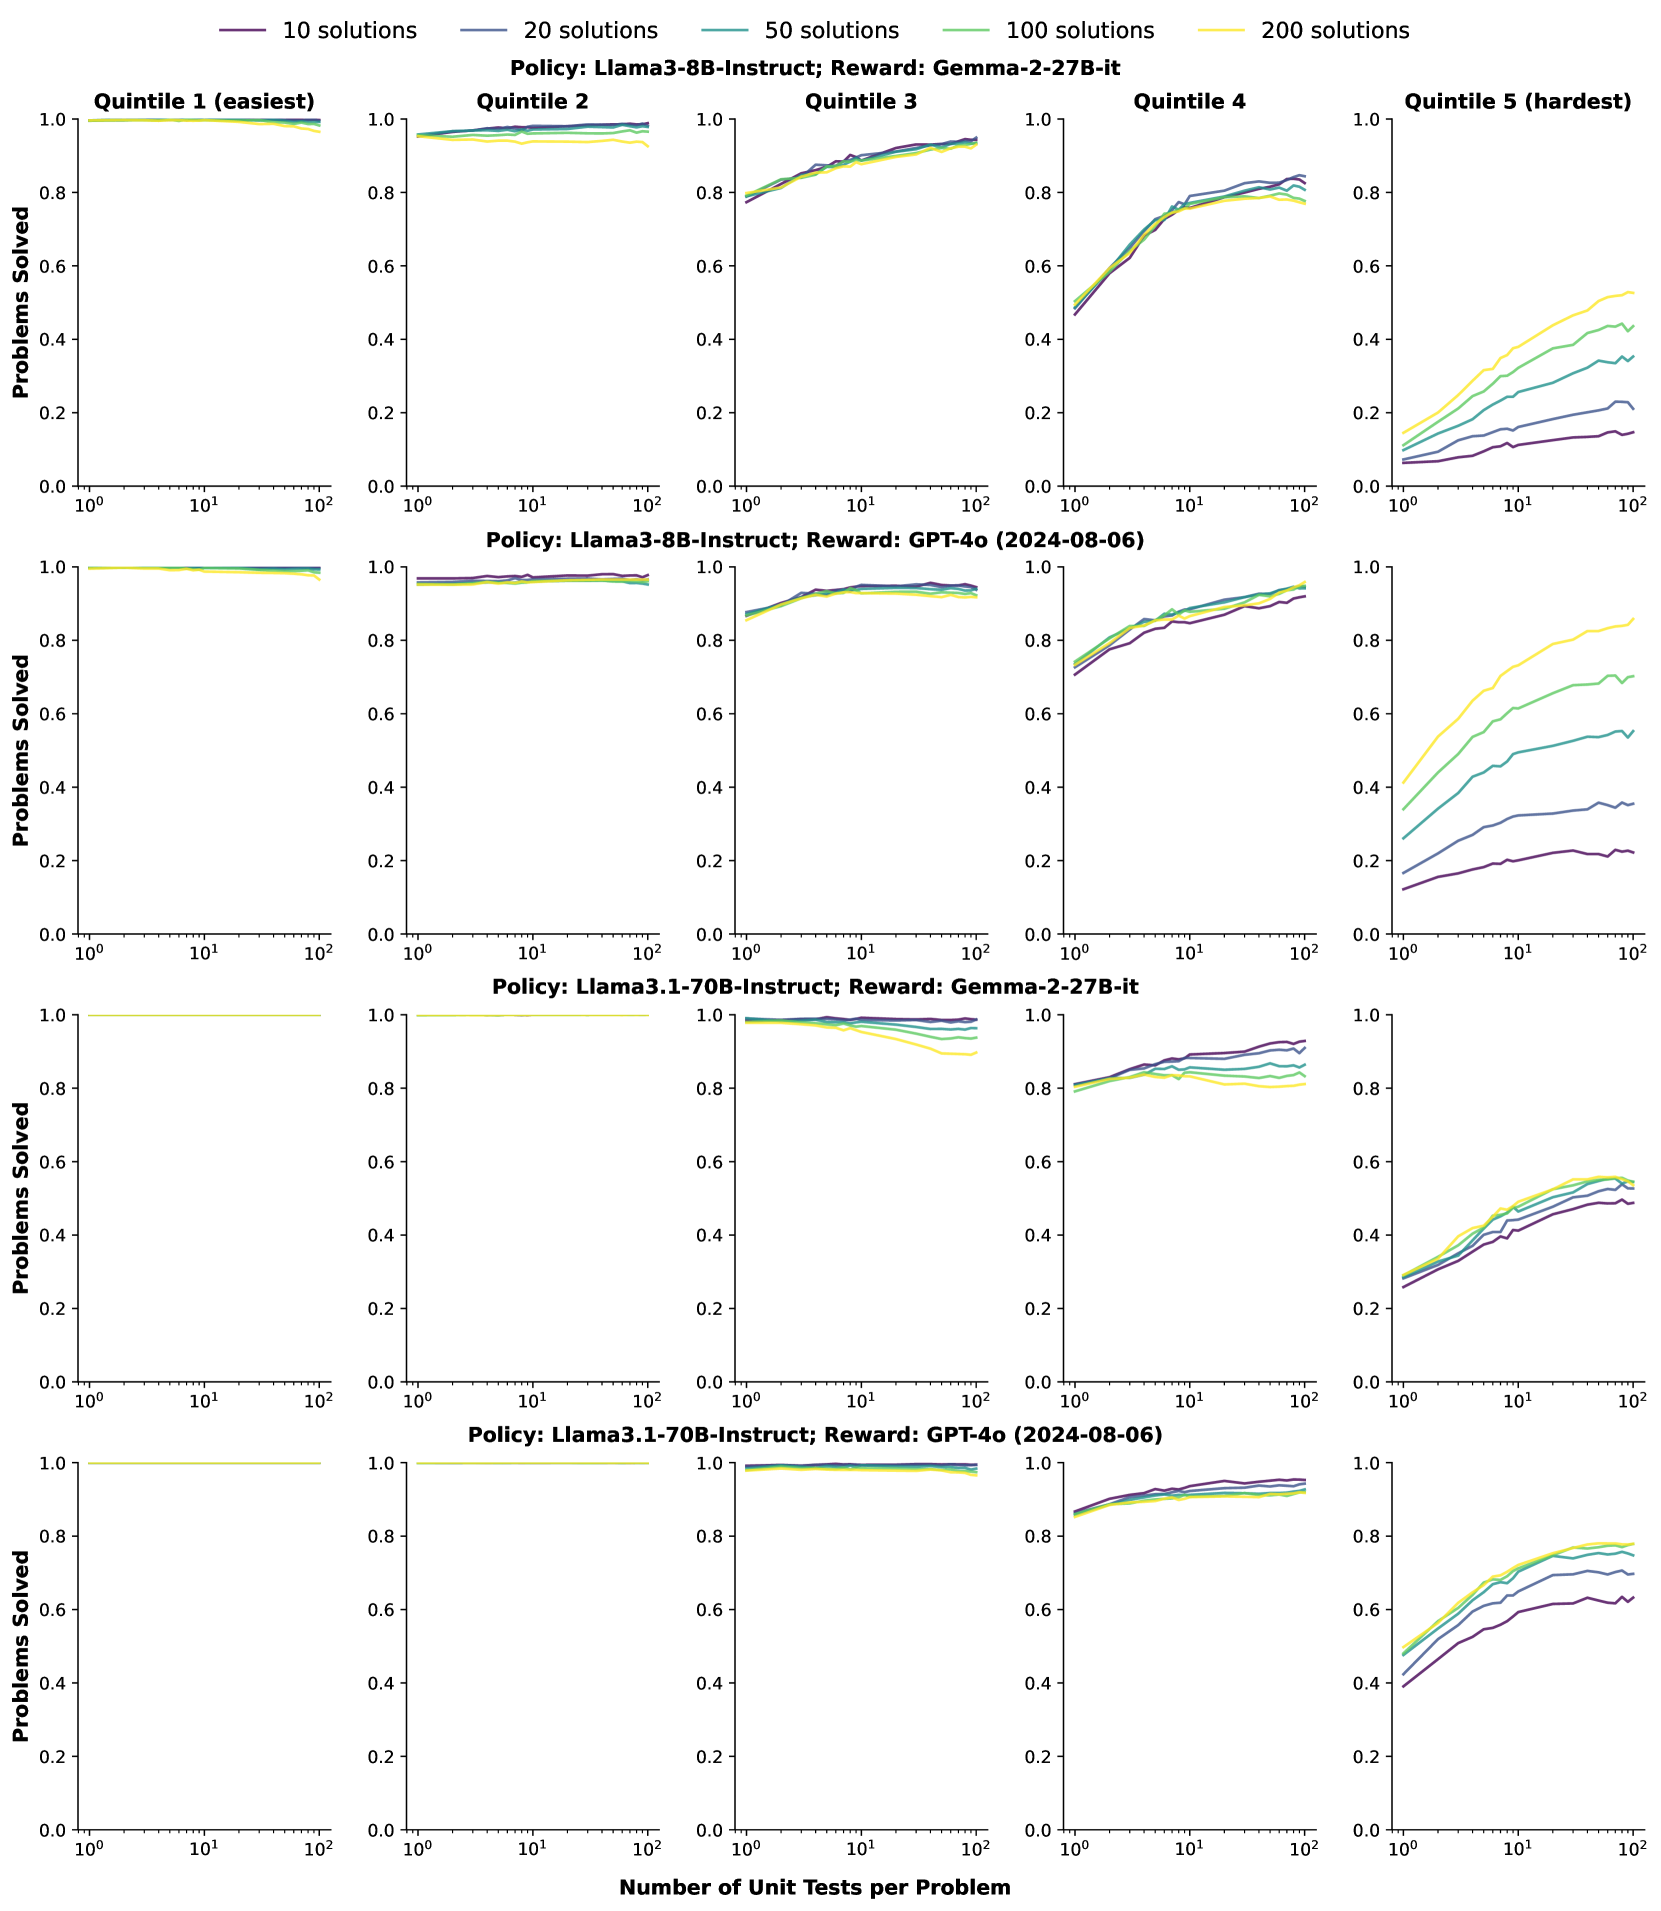
Figure 3: The improvements of best-of-N performance on problems of different difficulties. Quintile 1 (easiest) has the highest pass rate, while Quintile 2 (hardest) has the lowest pass rate. Scaling the quantity of unit tests significantly improves the accuracy on more complex problems.
2.2 Observations
Scaling the number of unit tests consistently improves the quality of the reward signal.
Figure1 demonstrates that increasing the number of unit tests consistently improves best-of-N performance across different quantities of code solutions, policy models, and reward models. As the number of code solutions increases, performance typically improves with more samples, since a larger sample size enhances the likelihood of generating accurate responses(Brown et al., 2024). However, in the third sub-figure of Figure1, performance decreases with additional test-time computation. This aligns with observations by Cobbe et al. (2021), where excessive test-time computation can generate adversarial solutions that mislead the verifier. For different policy models, scaling unit tests yields more pronounced performance improvements for weaker models compared to stronger ones. For instance, performance gains of 11%percent 11 11%11 % and 5%percent 5 5%5 % are observed for Llama3-8B and Llama3-70B, respectively, when employing GPT-4o as the reward model.
Figure2 compares the reward signals produced by different reward models. Generally, models with more parameters achieve better best-of-N performance. Notably, while Gemma-2-27B-it performs significantly worse than Llama3.1-70B with a single unit test, it achieves comparable performance when scaled to 100 100 100 100 unit tests per question. This may be attributed to smaller models generating responses with greater coverage and diversity, as discussed by Bansal et al. (2024).
Scaling unit tests is more effective for harder problems.
We evaluate the effectiveness of scaling unit tests across problems of different difficulty levels. Specifically, we first eliminate problems without a single correct solution. The remaining problems are divided into five equal parts based on the actual pass rate obtained via repeated sampling. Figure3 presents the results using Llama3-8B and Llama3.1-70B as the policy models, with Gemma-2-27B and GPT-4o as reward models. The results demonstrate that the benefits of scaling unit tests are highly dependent on problem complexity. For more challenging problems, increasing computational resources yields greater performance enhancement. This highlights the potential of dynamically scaling of unit tests based on problem difficulty, representing a viable approach for resource conservation within a fixed computational budget. More fine-grained results are provided in Appendix8.
3 Towards Efficient and High-Quality Unit Test Scaling
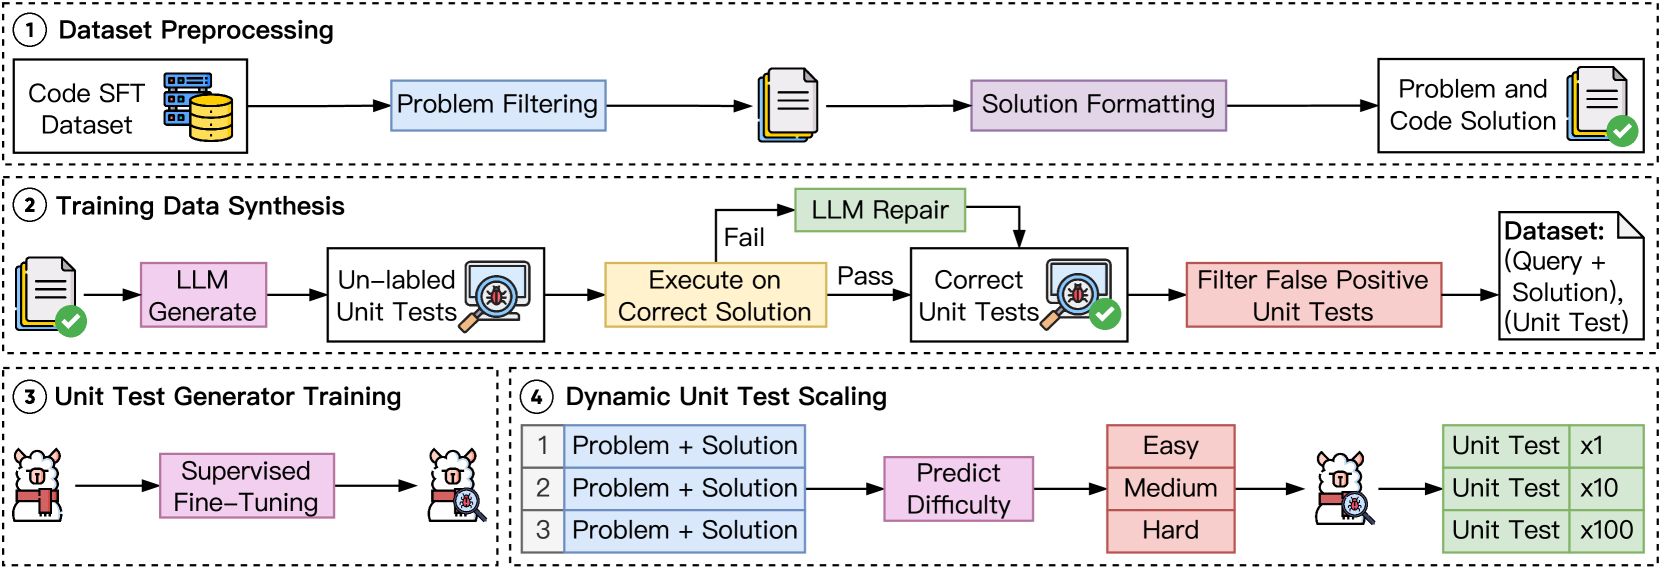
Figure 4: Overview for efficient and high-quality unit test scaling. First, we train a lightweight unit test generator based on high-quality synthetic data. Subsequently, we employ dynamic unit test scaling to further improve efficiency.
In light of the observations in Section2, we propose CodeRM-8B, a small yet effective unit test generator designed to enable efficient and high-quality unit test scaling. To this end, we introduce a synthetic data pipeline for generating high-quality unit tests and model training. Additionally, as shown in Section2, scaling unit tests proves to be more effective for harder problems. To further improve efficiency, we implement a dynamic scaling strategy that adapts to problems of varying difficulty. Specifically, following Damani et al. (2024), we train a problem difficulty classifier and employ a greedy algorithm to allocate computational resources dynamically, prioritizing harder problems.
3.1 Unit Test Generator
To train an effective unit test generator, we first construct high-quality training data through a data synthetic pipeline that includes dataset preprocessing and unit test generation, as illustrated in the first two sections in Figure4. We then apply supervised fine-tuning (SFT) to optimize the generator.
Dataset Preprocessing.
We utilize existing high-quality code instruction-tuning datasets as the foundation of our pipeline, including CodeFeedback-Filtered-Instruction 1 1 1https://huggingface.co/datasets/m-a-p/CodeFeedback-Filtered-Instruction(Zheng et al., 2024) and the training set of TACO 2 2 2https://huggingface.co/datasets/BAAI/TACO(Li et al., 2023). CodeFeedback-Filtered-Instruction is a carefully curated dataset of code instruction queries, derived from four prominent open-source code instruction tuning datasets (e.g., Magicoder-OSS-Instruct). TACO focuses on algorithmic code generation, featuring programming challenges from platforms such as LeetCode and Codeforces. To prepare these datasets for unit test generation, we first apply a principle-driven approach to filter out unsuitable questions for unit testing with Llama3.1-70B (e.g., tasks involving randomness), as presented in AppendixE. Subsequently, we restructure the original code solutions into functional formats to facilitate the following unit test generation.
Unit Test Generation.
Based on the queries and code solutions in the dataset, we employ Llama3.1-70B to generate diverse unit tests via repeated sampling. Each generated unit test is then executed on the ground truth code solution provided in the dataset. The execution results serve as true/false labels for the unit tests, with correct unit tests enabling the code solution to successfully pass the test. We observe that generating correct unit tests for difficult code instructions requires significant computational resources, often yielding only a small number of valid tests. To address this, we utilize execution feedback from the Python interpreter to repair incorrect unit tests, rather than relying solely on repeated sampling. By leveraging this feedback, Llama3.1-70B can efficiently repair tests, significantly improving the collection process for challenging problems. To further identify high-quality unit tests, we employ a quality control process. We adhere to the principle that a high-quality unit test should allow the correct solution to pass while rejecting as many incorrect solutions as possible. To achieve this, we generate incorrect solutions using a less capable model and filter out false positive unit tests (i.e., tests that fail to reject incorrect solutions).
Model Training
We utilize supervised fine-tuning (SFT) to train CodeRM-8B based on Llama3.1-8B. For the construction of training data, we use the problem and code solution as the instruction and the high-quality unit test as the answer. An example of the instruction-answer pair is presented in Figure9.
3.2 Dynamic Unit Test Scaling
Section2 presents that scaling unit tests is more effective for harder problems. To further enhance the efficiency of unit test scaling, we implement a dynamic scaling strategy that adapts to problems of different difficulty, which is shown in the fourth section of Figure4. Specifically, we follow Damani et al. (2024) to first train a problem difficulty classifier. Subsequently, we use a greedy algorithm to allocate more computation resources on more challenging questions.
Problem Difficulty Estimation.
To train the problem difficulty classifier, we first gather data using the preprocessed datasets from the synthetic data pipeline. The policy model generates multiple solutions through repeated sampling, which are then evaluated using previously collected correct unit tests as verifiers. The problem’s difficulty is estimated by calculating the mean success probability (i.e., pass rate) of these solutions.
Model Training.
We leverage the language model probing method(Alain and Bengio, 2017; Gurnee and Tegmark, 2024) to train a lightweight problem difficulty classifier. The probing method extracts implicit information from the intermediate representation, which is mapped into discrete classes by training a simple classifier(Zhang et al., 2024; Damani et al., 2024). Our problem difficulty classifier is a two-layer feedforward network with a scalar output to indicate the problem difficulties. This classifier generates minimal overhead since its inputs are hidden states already calculated during the decoding process. To train this classifier, we minimize the following cross-entropy loss:
∑x i,λ i[λ ilog(λ^(x i;θ))+(1−λ i)log(1−λ^(x i;θ))]subscript subscript 𝑥 𝑖 subscript 𝜆 𝑖 delimited-[]subscript 𝜆 𝑖^𝜆 subscript 𝑥 𝑖 𝜃 1 subscript 𝜆 𝑖 1^𝜆 subscript 𝑥 𝑖 𝜃\sum_{x_{i},\lambda_{i}}!\left[\lambda_{i}\log!\left(!\hat{\lambda}(x_{i};% \theta)!\right)!+!(1!-!\lambda_{i})\log!\left(!1!-!\hat{\lambda}(x_{i% };\theta)!\right)!\right]∑ start_POSTSUBSCRIPT italic_x start_POSTSUBSCRIPT italic_i end_POSTSUBSCRIPT , italic_λ start_POSTSUBSCRIPT italic_i end_POSTSUBSCRIPT end_POSTSUBSCRIPT [ italic_λ start_POSTSUBSCRIPT italic_i end_POSTSUBSCRIPT roman_log ( over^ start_ARG italic_λ end_ARG ( italic_x start_POSTSUBSCRIPT italic_i end_POSTSUBSCRIPT ; italic_θ ) ) + ( 1 - italic_λ start_POSTSUBSCRIPT italic_i end_POSTSUBSCRIPT ) roman_log ( 1 - over^ start_ARG italic_λ end_ARG ( italic_x start_POSTSUBSCRIPT italic_i end_POSTSUBSCRIPT ; italic_θ ) ) ]
where x i subscript 𝑥 𝑖 x_{i}italic_x start_POSTSUBSCRIPT italic_i end_POSTSUBSCRIPT is the i 𝑖 i italic_i-th query, θ 𝜃\theta italic_θ is the parameters of the classifier, λ i subscript 𝜆 𝑖\lambda_{i}italic_λ start_POSTSUBSCRIPT italic_i end_POSTSUBSCRIPT is the actual pass rate, and λ^(x i;θ)^𝜆 subscript 𝑥 𝑖 𝜃\hat{\lambda}(x_{i};\theta)over^ start_ARG italic_λ end_ARG ( italic_x start_POSTSUBSCRIPT italic_i end_POSTSUBSCRIPT ; italic_θ ) is the predicted pass rate (i.e., problem difficulty).
Dynamic Compution Allocation.
We allocate more computation budgets on more challenging problems, following the method used by Damani et al. (2024). For a question x 𝑥 x italic_x with pass rate λ 𝜆\lambda italic_λ, the reward for allocating b 𝑏 b italic_b computation budget to this question is given by:
q(x,b)=1−(1−λ)b,𝑞 𝑥 𝑏 1 superscript 1 𝜆 𝑏 q(x,b)=1-(1-\lambda)^{b},italic_q ( italic_x , italic_b ) = 1 - ( 1 - italic_λ ) start_POSTSUPERSCRIPT italic_b end_POSTSUPERSCRIPT ,(2)
which represents the probability of getting at least one correct answer in b 𝑏 b italic_b attempts. Since for any question x 𝑥 x italic_x, the reward function q(x,b)𝑞 𝑥 𝑏 q(x,b)italic_q ( italic_x , italic_b ) is monotonically increasing with respect to b 𝑏 b italic_b, we adopt a greedy algorithm to allocate computational resources across different questions.
4 Experiments
4.1 Experimental Setup
Datasets and Metrics.
We conduct extensive experiments on three widely used benchmarks, including HumanEval Plus(Liu et al., 2023), MBPP Plus(Liu et al., 2023), and LiveCodeBench(Jain et al., 2024). HumanEval Plus and MBPP Plus are derived from HumanEval(Chen et al., 2021) and MBPP(Austin et al., 2021) with additional test cases. LiveCodeBench is a contamination-free dataset that continuously collects new problems over time. We select the queries from 2024-01 to 2024-09 to avoid the contamination problem with our training data. We focus on the queries with solutions in functional format, ultimately yielding 168 168 168 168 queries. The evaluation metric is Pass@k@𝑘@k@ italic_k(Chen et al., 2021), with k 𝑘 k italic_k set to 1 1 1 1 in our experiments.
Method Policy Model Llama3-8B Llama3-70B GPT-3.5 GPT-4o-m HumanEval Plus Vanilla 53.58 73.74 67.83 82.96 Grading RM 62.20 +8.62 75.00 +1.26 70.12 +2.29 83.50 +0.54 MBR-Exec 60.30 +6.72 75.80 +2.06 70.60 +2.77 85.20 +2.24 CodeT 65.30 +11.72 76.20 +2.46 73.89 +6.06 85.30 +2.34 MPSC 59.72 +6.14 75.51 +1.77 72.76 +4.93 84.82 +1.86 Llama3.1-70B 72.04 +18.46 78.54 +4.80 79.76 +11.93 85.45 +2.49 CodeRM-8B 72.01 +18.43 78.69 +4.95 78.01 +10.18 86.38 +3.42 MBPP Plus Vanilla 49.20 69.33 70.53 71.59 Grading RM 48.40 -0.80 70.60 +1.27 66.67 -3.86 69.00 -2.59 MBR-Exec 50.00 +0.80 69.80 +0.47 70.53 +0.00 72.30 +0.71 CodeT 59.20 +10.00 69.90 +0.57 69.92 -0.61 73.40 +1.81 MPSC 53.32 +4.12 70.91 +1.58 71.59 +1.06 73.20 +1.61 Llama3.1-70B 65.26 +16.06 71.85 +2.52 75.72 +5.19 74.96 +3.37 CodeRM-8B 66.71 +17.51 72.44 +3.11 75.96 +5.43 75.20 +3.61 LiveCodeBench Vanilla 11.98 25.30 20.55 34.83 Grading RM 13.10 +1.12 26.19 +0.89 20.83 +0.28 36.31 +1.48 MBR-Exec 12.04 +0.06 25.37 +0.07 20.52 -0.03 34.83 +0.00 CodeT 12.61 +0.63 25.89 +0.59 20.58 +0.03 35.13 +0.30 MPSC 11.98 +0.00 25.30 +0.00 20.55 +0.00 34.83 +0.00 Llama3.1-70B 13.28 +1.30 28.46 +3.16 22.80 +2.25 38.60 +3.77 CodeRM-8B 15.21 +3.23 27.73 +2.43 21.76 +1.21 39.20 +4.37
Table 1: The main result of our approach and other baselines over three code generation benchmarks. GPT-4o-m stands for GPT-4o-mini. The improvements are calculated between methods and vanilla. The top two performances for each dataset and policy model are marked in bold and underlined.
Baselines and Implementations.
We compare several baselines on four policy models, including Llama3-8B(Dubey et al., 2024), Llama3-70B(Dubey et al., 2024), GPT-3.5-turbo 3 3 3https://chat.openai.com/, and GPT-4o-mini Achiam et al. (2023). The baselines include the vanilla method that randomly selects a solution, the grading reward model, MBR-Exec(Shi et al., 2022), CodeT(Chen et al., 2023), and MPSC(Huang et al., 2024a). For the grading reward model, we employ ArmoRM-Llama3-8B-v0.1(Wang et al., 2024) and generate a scalar score for each candidate solution. For other baselines, we utilize Llama3.1-70B to generate test cases, using the same computation budget to conduct fair comparisons. For our method, we employ the majority voting framework in Section2.1 and utilize Llama3.1-70B and CodeRM-8B as unit test generator. AppendixC presents the detailed experimental setting and the implementation of all baselines.

Figure 5: The performance of three different unit test generators (reward model) on different quantities of unit tests, while employing Llama3-8B as the policy model.
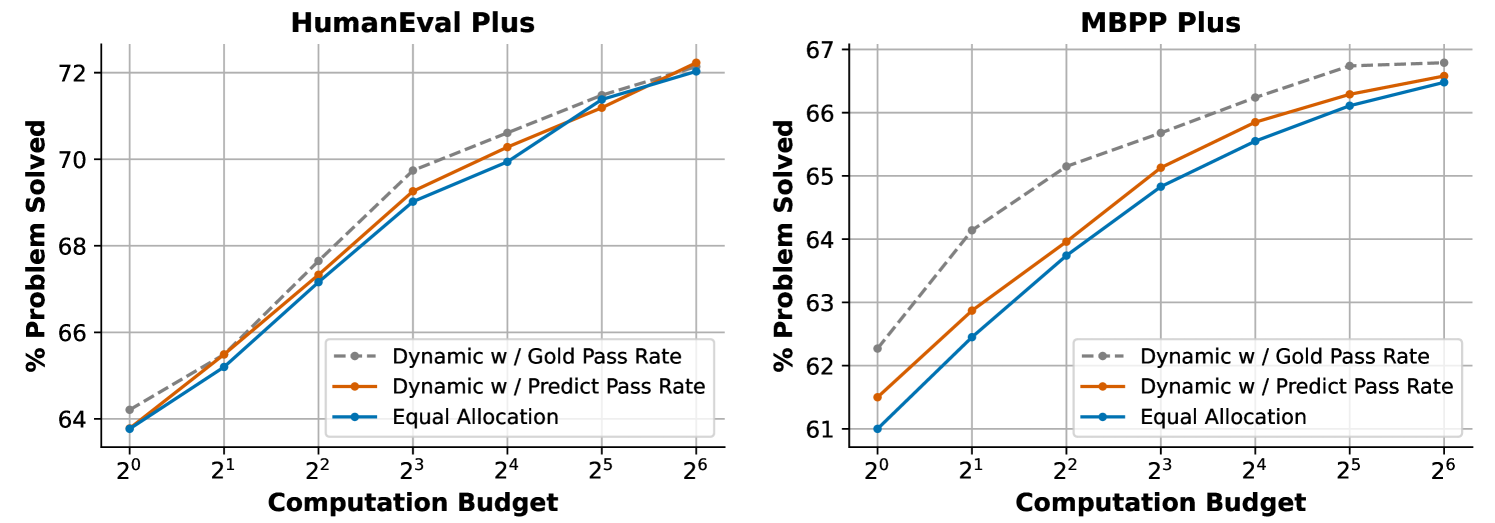
Figure 6: Best-of-N performance comparison under unit test scaling with three computation budget allocation strategies: dynamic allocation with gold pass rate, dynamic allocation with predicted pass rate, and equal allocation.
4.2 Main Results
Effectiveness of CodeRM-8B.
Table1 summarizes the experimental results on three code generation benchmarks. Under our unit test-based majority voting framework, both Llama3.1-70B and CodeRM-8B significantly improve the performance of four policy models across all benchmarks. Notably, the best-of-N performance of CodeRM-8B is on par with Llama3.1-70B, a model with nearly 8x more parameters. Across all three benchmarks, CodeRM-8B demonstrates consistent and substantial enhancements to the performance of policy models at varying scales and types. For example, on HumanEval Plus, CodeRM-8B achieves a substantial performance improvement of 18.43% for the smaller model Llama3-8B, while also enhancing the performance of larger models and proprietary models, such as Llama3-70B and GPT-4o-mini, by 4.95% and 3.42%, respectively. Figure5 visualizes the performance of various unit test generators as the number of unit tests scales. The results highlight that CodeRM-8B achieves performance comparable to Llama3.1-70B while substantially surpassing Llama3.1-8B, emphasizing its effectiveness and computational efficiency.
Performance of Dynamic Scaling.
Figure6 presents the performance of our dynamic unit test scaling implementation, which leverages Equation(2) to allocate computation budgets based on predicted pass rates. We compare it against two baselines: 1) dynamic allocation with gold pass rates, which uses actual pass rates instead of predictions, and 2) equal allocation, which does not apply dynamic scaling. Results show that our method improves performance under fixed computational budgets, with more pronounced gains on MBPP Plus due to its higher question difficulty compared to HumanEval Plus, making dynamic scaling more impactful. Future work could explore more accurate difficulty classifiers or alternative allocation algorithms to further improve performance.
4.3 Quality of Generated Unit Tests
Table 2: The quality of individual unit tests and the combination of multiple unit tests on HumanEval Plus, utilizing Llama3.1-8B as the policy model. The top two performances are highlighted using bold and underlining.
We evaluate the quality of the unit test generated by CodeRM-8B. As each unit test functions as a classifier to determine correct or incorrect solutions, we first utilize accuracy and F1 score as metrics to assess the classification performance of the unit test. We further propose two new metrics to detailed evaluate the possibility of the unit test making incorrect judgments. False Acceptance Rate (FAR) measures the probability that unit tests incorrectly accept invalid solutions. False Rejection Rate (FRR) measures the probability that unit tests incorrectly reject valid solutions. The calculation formulas for these four metrics are introduced in AppendixD.
Table2 presents the quality of reward signal produced by an individual unit test and the combination of 100 100 100 100 unit tests under our majority voting framework. The results indicate that the trained CodeRM-8B renders more precise assessments of solutions and makes fewer errors than the original Llama3.1-8B. Moreover, we note that while the quality of individual unit tests of CodeRM-8B is inferior to Llama3.1-70B, the quality of multiple unit tests is superior. This phenomenon may suggest that CodeRM-8B produces more diverse unit tests, offering diverse perspectives within our majority voting framework and resulting in a higher quality of code reward signal.
4.4 Ablation Study of Synthetic Data
We conduct ablation studies to investigate the effectiveness of data quality control and instruction-tuning data size in our synthetic data pipeline.
Table 3: The effects of synthetic data quality control.
Data Quality.
Filtering false positive unit tests is a critical component for increasing training data quality in our synthetic data pipeline. We evaluate the performance of CodeRM-8B against the trained model that lacks this quality control procedure. Table3 presents that the quality control procedure significantly increased the performance of the trained model, with relative performance gains of approximately 45%percent 45 45%45 % and 80%percent 80 80%80 % on HumanEval Plus and MBPP Plus, respectively, compared to training without quality control.
Data Size.
Data size is also a crucial factor in enhancing the model’s performance. We evaluate the performance of the model trained on different amounts of training data. Figure7 presents that as the data size increases, the model’s performance consistently improves. This observation demonstrates that collecting more high-quality instruction-tuning data and using our data synthesis pipeline to generate more high-quality unit tests can substantially enhance model performance.
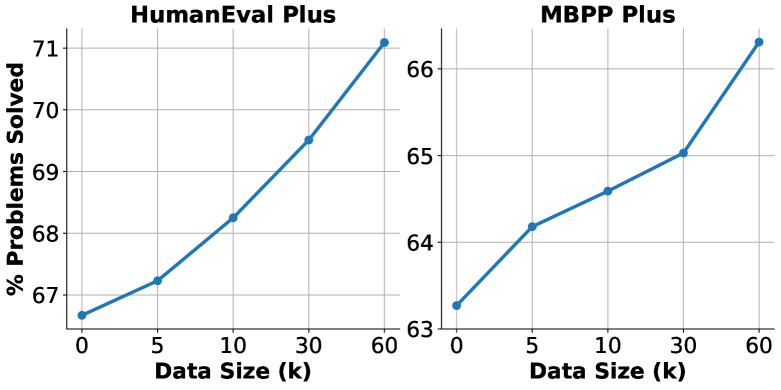
Figure 7: The effects of data size.
5 Related Work
Reranking and selection for optimal solutions.
Current reranking techniques for optimal solution selection can be classified into two categories: execution-based and non-execution-based methods. Execution-based methods leverage test cases as verifiers for selecting optimal code solutions(Li et al., 2022; Shi et al., 2022; Chen et al., 2023; Zhang et al., 2023a; Chen et al., 2024a). For example, Shi et al. (2022) employ execution result-based minimum Bayes risk decoding for solution selection. Chen et al. (2023) evaluate output consistency with generated test cases and concordance with other candidate code solutions. Non-execution-based methods use deep learning-based rerankers for optimal code solution selection(Inala et al., 2022; Zhang et al., 2023b). Inala et al. (2022) trains a neural reranker utilizing the code execution results as labels for classification. Zhang et al. (2023b) utilizes a collaborative system that employs additional reviewer models to assess the likelihood of the instructions based on the generated code solutions. In this paper, we discover the effects of dynamic scaling of unit tests over programming problems.
Unit test generation.
The expense of human-created and maintained unit tests prompts the advancement of automatic unit test generation techniques. Traditional methods, such as search-based(Harman and McMinn, 2010; Lukasczyk and Fraser, 2022), constraint-based(Xiao et al., 2013), and probability-based approaches(Pacheco et al., 2007), often achieve acceptable correctness but suffer from limited coverage, poor readability, and are typically restricted to regression or implicit oracles(Barr et al., 2015). Recently, deep learning models, particularly large language models, have gained traction for unit test generation(Alagarsamy et al., 2024; Chen et al., 2024b; Schäfer et al., 2024; Yuan et al., 2024). In this paper, we propose a data synthetic pipeline and train a model for high-quality unit test generation.
6 Conclusion
This paper investigates the impact of scaling unit tests on improving the quality of code reward signals. Pioneer results demonstrate a positive correlation between unit test number and reward signal quality, with more greater benefits observed in challenging problems. To facilitate efficient and high-quality unit test scaling, we train a small yet powerful unit test generator and implement a dynamic scaling strategy. Experimental results demonstrate that our approach significantly boosts the performance of models in various parameter sizes.
7 Limitations
Implementation of Dynamic Scaling.
Our implementation of dynamic unit test scaling is based on the method proposed by Damani et al. (2024), which allocates more computational resources to harder problems. However, while Damani et al. (2024) directly optimizes the allocation of computational resources for the policy model (i.e., models that generate responses), their approach does not directly extend to optimizing the reward model (i.e., models that generate verifiers). Consequently, directly adopting this method may not be entirely appropriate in our context. As shown in Figure6, the performance improvement is relatively modest when computation budgets are allocated based on the gold pass rate on HumanEval Plus. Future research could explore more effective methods for dynamically scaling the number of unit tests based on varying problem difficulties.
Diversity and Coverage of Unit Test.
We observe in Section2 that Gemma-2-27B-it performs significantly worse than Llama3.1-70B when using a single unit test. However, its performance becomes comparable when scaled to 100 unit tests per question. This observation suggests that Gemma-2-27B-it may generate more diverse and higher-coverage unit tests than Llama3.1-70B through repeated sampling. Future work could explore the diversity and coverage of unit tests as the number of unit tests scales, which may provide insights into training more effective reward models for improved supervision accuracy.
References
- Achiam et al. (2023) Josh Achiam, Steven Adler, Sandhini Agarwal, Lama Ahmad, Ilge Akkaya, Florencia Leoni Aleman, Diogo Almeida, Janko Altenschmidt, Sam Altman, Shyamal Anadkat, et al. 2023. Gpt-4 technical report. arXiv preprint arXiv:2303.08774.
- Alagarsamy et al. (2024) Saranya Alagarsamy, Chakkrit Tantithamthavorn, and Aldeida Aleti. 2024. A3test: Assertion-augmented automated test case generation. Inf. Softw. Technol., 176(C).
- Alain and Bengio (2017) Guillaume Alain and Yoshua Bengio. 2017. Understanding intermediate layers using linear classifier probes. In ICLR (Workshop).
- Austin et al. (2021) Jacob Austin, Augustus Odena, Maxwell Nye, Maarten Bosma, Henryk Michalewski, David Dohan, Ellen Jiang, Carrie Cai, Michael Terry, Quoc Le, et al. 2021. Program synthesis with large language models. arXiv preprint arXiv:2108.07732.
- Bansal et al. (2024) Hritik Bansal, Arian Hosseini, Rishabh Agarwal, Vinh Q Tran, and Mehran Kazemi. 2024. Smaller, weaker, yet better: Training llm reasoners via compute-optimal sampling. arXiv preprint arXiv:2408.16737.
- Barr et al. (2015) Earl T. Barr, Mark Harman, Phil McMinn, Muzammil Shahbaz, and Shin Yoo. 2015. The oracle problem in software testing: A survey. IEEE Transactions on Software Engineering, 41(5):507–525.
- Brown et al. (2024) Bradley Brown, Jordan Juravsky, Ryan Ehrlich, Ronald Clark, Quoc V Le, Christopher Ré, and Azalia Mirhoseini. 2024. Large language monkeys: Scaling inference compute with repeated sampling. arXiv preprint arXiv:2407.21787.
- Chen et al. (2023) Bei Chen, Fengji Zhang, Anh Nguyen, Daoguang Zan, Zeqi Lin, Jian-Guang Lou, and Weizhu Chen. 2023. Codet: Code generation with generated tests. In The Eleventh International Conference on Learning Representations.
- Chen et al. (2021) Mark Chen, Jerry Tworek, Heewoo Jun, Qiming Yuan, Henrique Ponde De Oliveira Pinto, Jared Kaplan, Harri Edwards, Yuri Burda, Nicholas Joseph, Greg Brockman, et al. 2021. Evaluating large language models trained on code. arXiv preprint arXiv:2107.03374.
- Chen et al. (2024a) Mouxiang Chen, Zhongxin Liu, He Tao, Yusu Hong, David Lo, Xin Xia, and Jianling Sun. 2024a. B4: Towards optimal assessment of plausible code solutions with plausible tests. In Proceedings of the 39th IEEE/ACM International Conference on Automated Software Engineering, ASE ’24, page 1693–1705, New York, NY, USA. Association for Computing Machinery.
- Chen et al. (2024b) Yinghao Chen, Zehao Hu, Chen Zhi, Junxiao Han, Shuiguang Deng, and Jianwei Yin. 2024b. Chatunitest: A framework for llm-based test generation. In Companion Proceedings of the 32nd ACM International Conference on the Foundations of Software Engineering, FSE 2024, page 572–576, New York, NY, USA. Association for Computing Machinery.
- Cobbe et al. (2021) Karl Cobbe, Vineet Kosaraju, Mohammad Bavarian, Mark Chen, Heewoo Jun, Lukasz Kaiser, Matthias Plappert, Jerry Tworek, Jacob Hilton, Reiichiro Nakano, et al. 2021. Training verifiers to solve math word problems. arXiv preprint arXiv:2110.14168.
- Damani et al. (2024) Mehul Damani, Idan Shenfeld, Andi Peng, Andreea Bobu, and Jacob Andreas. 2024. Learning how hard to think: Input-adaptive allocation of lm computation. arXiv preprint arXiv:2410.04707.
- Dubey et al. (2024) Abhimanyu Dubey, Abhinav Jauhri, Abhinav Pandey, Abhishek Kadian, Ahmad Al-Dahle, Aiesha Letman, Akhil Mathur, Alan Schelten, Amy Yang, Angela Fan, et al. 2024. The llama 3 herd of models. arXiv preprint arXiv:2407.21783.
- Edmonds (1971) Jack Edmonds. 1971. Matroids and the greedy algorithm. Mathematical programming, 1:127–136.
- Efron (1979) B.Efron. 1979. Bootstrap Methods: Another Look at the Jackknife. The Annals of Statistics, 7(1):1 – 26.
- Gao et al. (2023) Leo Gao, John Schulman, and Jacob Hilton. 2023. Scaling laws for reward model overoptimization. In International Conference on Machine Learning, pages 10835–10866. PMLR.
- Gurnee and Tegmark (2024) Wes Gurnee and Max Tegmark. 2024. Language models represent space and time. In The Twelfth International Conference on Learning Representations.
- Harman and McMinn (2010) Mark Harman and Phil McMinn. 2010. A theoretical and empirical study of search-based testing: Local, global, and hybrid search. IEEE Transactions on Software Engineering, 36(2):226–247.
- Huang et al. (2024a) Baizhou Huang, Shuai Lu, Xiaojun Wan, and Nan Duan. 2024a. Enhancing large language models in coding through multi-perspective self-consistency. In Proceedings of the 62nd Annual Meeting of the Association for Computational Linguistics (Volume 1: Long Papers), pages 1429–1450, Bangkok, Thailand. Association for Computational Linguistics.
- Huang et al. (2024b) Jie Huang, Xinyun Chen, Swaroop Mishra, Huaixiu Steven Zheng, Adams Wei Yu, Xinying Song, and Denny Zhou. 2024b. Large language models cannot self-correct reasoning yet. In The Twelfth International Conference on Learning Representations.
- Huang et al. (2024c) Lei Huang, Weijiang Yu, Weitao Ma, Weihong Zhong, Zhangyin Feng, Haotian Wang, Qianglong Chen, Weihua Peng, Xiaocheng Feng, Bing Qin, and Ting Liu. 2024c. A survey on hallucination in large language models: Principles, taxonomy, challenges, and open questions. ACM Transactions on Information Systems.
- Inala et al. (2022) Jeevana Priya Inala, Chenglong Wang, Mei Yang, Andres Codas, Mark Encarnación, Shuvendu K Lahiri, Madanlal Musuvathi, and Jianfeng Gao. 2022. Fault-aware neural code rankers. In Advances in Neural Information Processing Systems.
- Jain et al. (2024) Naman Jain, King Han, Alex Gu, Wen-Ding Li, Fanjia Yan, Tianjun Zhang, Sida Wang, Armando Solar-Lezama, Koushik Sen, and Ion Stoica. 2024. Livecodebench: Holistic and contamination free evaluation of large language models for code. arXiv preprint arXiv:2403.07974.
- Kadavath et al. (2022) Saurav Kadavath, Tom Conerly, Amanda Askell, Tom Henighan, Dawn Drain, Ethan Perez, Nicholas Schiefer, Zac Hatfield-Dodds, Nova DasSarma, Eli Tran-Johnson, et al. 2022. Language models (mostly) know what they know. arXiv preprint arXiv:2207.05221.
- Li et al. (2023) Rongao Li, Jie Fu, Bo-Wen Zhang, Tao Huang, Zhihong Sun, Chen Lyu, Guang Liu, Zhi Jin, and Ge Li. 2023. Taco: Topics in algorithmic code generation dataset. arXiv preprint arXiv:2312.14852.
- Li et al. (2022) Yujia Li, David Choi, Junyoung Chung, Nate Kushman, Julian Schrittwieser, Rémi Leblond, Tom Eccles, James Keeling, Felix Gimeno, Agustin Dal Lago, Thomas Hubert, Peter Choy, Cyprien de Masson d’Autume, Igor Babuschkin, Xinyun Chen, Po-Sen Huang, Johannes Welbl, Sven Gowal, Alexey Cherepanov, James Molloy, Daniel J. Mankowitz, Esme Sutherland Robson, Pushmeet Kohli, Nando de Freitas, Koray Kavukcuoglu, and Oriol Vinyals. 2022. Competition-level code generation with alphacode. Science, 378(6624):1092–1097.
- Lightman et al. (2024) Hunter Lightman, Vineet Kosaraju, Yuri Burda, Harrison Edwards, Bowen Baker, Teddy Lee, Jan Leike, John Schulman, Ilya Sutskever, and Karl Cobbe. 2024. Let’s verify step by step. In The Twelfth International Conference on Learning Representations.
- Liu et al. (2023) Jiawei Liu, Chunqiu Steven Xia, Yuyao Wang, and LINGMING ZHANG. 2023. Is your code generated by chatGPT really correct? rigorous evaluation of large language models for code generation. In Thirty-seventh Conference on Neural Information Processing Systems.
- Lukasczyk and Fraser (2022) Stephan Lukasczyk and Gordon Fraser. 2022. Pynguin: automated unit test generation for python. In Proceedings of the ACM/IEEE 44th International Conference on Software Engineering: Companion Proceedings, ICSE ’22, page 168–172, New York, NY, USA. Association for Computing Machinery.
- Pacheco et al. (2007) Carlos Pacheco, Shuvendu K. Lahiri, Michael D. Ernst, and Thomas Ball. 2007. Feedback-directed random test generation. In 29th International Conference on Software Engineering (ICSE’07), pages 75–84.
- Schäfer et al. (2024) Max Schäfer, Sarah Nadi, Aryaz Eghbali, and Frank Tip. 2024. An empirical evaluation of using large language models for automated unit test generation. IEEE Transactions on Software Engineering, 50(1):85–105.
- Shi et al. (2022) Freda Shi, Daniel Fried, Marjan Ghazvininejad, Luke Zettlemoyer, and Sida I. Wang. 2022. Natural language to code translation with execution. In Proceedings of the 2022 Conference on Empirical Methods in Natural Language Processing, pages 3533–3546, Abu Dhabi, United Arab Emirates. Association for Computational Linguistics.
- Snell et al. (2024) Charlie Snell, Jaehoon Lee, Kelvin Xu, and Aviral Kumar. 2024. Scaling llm test-time compute optimally can be more effective than scaling model parameters. arXiv preprint arXiv:2408.03314.
- Svyatkovskiy et al. (2020) Alexey Svyatkovskiy, Shao Kun Deng, Shengyu Fu, and Neel Sundaresan. 2020. Intellicode compose: code generation using transformer. In Proceedings of the 28th ACM Joint Meeting on European Software Engineering Conference and Symposium on the Foundations of Software Engineering, ESEC/FSE 2020, page 1433–1443, New York, NY, USA. Association for Computing Machinery.
- Touvron et al. (2023) Hugo Touvron, Thibaut Lavril, Gautier Izacard, Xavier Martinet, Marie-Anne Lachaux, Timothée Lacroix, Baptiste Rozière, Naman Goyal, Eric Hambro, Faisal Azhar, et al. 2023. Llama: Open and efficient foundation language models. arXiv preprint arXiv:2302.13971.
- Wang et al. (2024) Haoxiang Wang, Wei Xiong, Tengyang Xie, Han Zhao, and Tong Zhang. 2024. Interpretable preferences via multi-objective reward modeling and mixture-of-experts. In Findings of the Association for Computational Linguistics: EMNLP 2024, pages 10582–10592, Miami, Florida, USA. Association for Computational Linguistics.
- Wang et al. (2023) Xuezhi Wang, Jason Wei, Dale Schuurmans, Quoc V Le, Ed H. Chi, Sharan Narang, Aakanksha Chowdhery, and Denny Zhou. 2023. Self-consistency improves chain of thought reasoning in language models. In The Eleventh International Conference on Learning Representations.
- Xiao et al. (2013) Xusheng Xiao, Sihan Li, Tao Xie, and Nikolai Tillmann. 2013. Characteristic studies of loop problems for structural test generation via symbolic execution. In 2013 28th IEEE/ACM International Conference on Automated Software Engineering (ASE), pages 246–256.
- Yuan et al. (2024) Zhiqiang Yuan, Mingwei Liu, Shiji Ding, Kaixin Wang, Yixuan Chen, Xin Peng, and Yiling Lou. 2024. Evaluating and improving chatgpt for unit test generation. Proc. ACM Softw. Eng., 1(FSE).
- Zhang et al. (2023a) Kexun Zhang, Danqing Wang, Jingtao Xia, William Yang Wang, and Lei Li. 2023a. ALGO: Synthesizing algorithmic programs with generated oracle verifiers. In Thirty-seventh Conference on Neural Information Processing Systems.
- Zhang et al. (2023b) Tianyi Zhang, Tao Yu, Tatsunori Hashimoto, Mike Lewis, Wen-Tau Yih, Daniel Fried, and Sida Wang. 2023b. Coder reviewer reranking for code generation. In ICML, pages 41832–41846.
- Zhang et al. (2024) Xiaokang Zhang, Zijun Yao, Jing Zhang, Kaifeng Yun, Jifan Yu, Juanzi Li, and Jie Tang. 2024. Transferable and efficient non-factual content detection via probe training with offline consistency checking. In Proceedings of the 62nd Annual Meeting of the Association for Computational Linguistics (Volume 1: Long Papers), pages 12348–12364, Bangkok, Thailand. Association for Computational Linguistics.
- Zheng et al. (2024) Tianyu Zheng, Ge Zhang, Tianhao Shen, Xueling Liu, Bill Yuchen Lin, Jie Fu, Wenhu Chen, and Xiang Yue. 2024. OpenCodeInterpreter: Integrating code generation with execution and refinement. In Findings of the Association for Computational Linguistics: ACL 2024, pages 12834–12859, Bangkok, Thailand. Association for Computational Linguistics.
Appendix A License
We utilize the CodeFeedback-Filtered-Instruction dataset and the training set from TACO as the data sources for generating high-quality unit tests. Both datasets are distributed under the Apache 2.0 license, which permits users to freely use, copy, modify, and distribute the software for both personal and commercial purposes.
The parameters of CodeRM-8B, along with the corresponding training data, will be made publicly available upon acceptance. The training data exclusively consists of synthetic code solutions and unit tests, without any personally identifying information or offensive content. We will release the LLM-generated data and the models fine-tuned on this data under the Apache 2.0 license.
Appendix B More Results of Unit Test Scaling

Figure 8: The performance gain of scaling the number of unit tests on problems of different difficulties across various policy model and reward model. Overall, increasing the number of unit tests yields greater performance improvements on more challenging problems, particularly when employing Llama3.1-70B as the policy model.
Figure8 presents a more fine-grained analysis by categorizing questions based on their difficulty. The results further confirm that increasing the number of unit tests generally leads to larger performance improvements on more challenging problems. This trend becomes particularly evident when leveraging more advanced models, such as Llama3.1-70B as the policy model or GPT-4o as the reward model.
Appendix C Experiment Settings and Baselines
The experiments employ four policy models of various parameter sizes and types, including Llama3-8B-Instruct, Llama3-70B-Instruct, GPT-3.5-turbo, and GPT-4o-mini. For each policy model, we generate 100 100 100 100 candidate code solutions, following the hyperparameters in Table4. All models are deployed and inferenced using 8 NVIDIA A800 GPUs.
For the baselines, we first utilize a grading reward model, which takes a candidate code solution as input and outputs a scalar score representing the quality of the solution. Specifically, we employ ArmoRM-Llama3-8B-v0.1, a powerful reward model that leverages mixture-of-experts (MoE) aggregation across multiple reward objectives. In addition, we include several baselines that use unit tests as verifiers to identify correct code solutions:
- •MBR-Exec: This method ranks solutions using minimum Bayes risk (MBR) decoding based on the execution results of LLM-generated test cases. For our experiments, we adopt the hard loss variant of this approach.
- •CodeT: This baseline evaluates the consistency of outputs with generated test cases and assesses concordance among candidate code solutions through a dual execution agreement mechanism.
- •MPSC: This method evaluates candidate code solutions from three perspectives: solution, specification, and test case. It constructs a 3-partite graph to identify the optimal solution.
To ensure a fair comparison, all baselines leveraging unit tests are provided with the same computational budget of 100 100 100 100 inferences. For MBR-Exec and CodeT, we perform 100 100 100 100 inferences and prompt the LLM to generate 10 10 10 10 test cases for each inference, following the setup of CodeT. For MPSC, under the same computational constraints, we instruct the LLM to generate 50 50 50 50 test cases and 50 50 50 50 specifications.
Hyperparameters Value Temperature 0.8 Top P 0.95 Frequency Penalty 0 Presence Penalty 0
Table 4: The hyperparameters of LLMs for solution and unit test generation.
Appendix D Metrics for Assessing Unit Test Quality
We introduce the details for computing the four metrics for evaluating the quality of unit tests in Section4.3. To evaluate the quality of the generated unit tests, we define four metrics: Accuracy, F1 Score, False Acceptance Rate (FAR), and False Rejection Rate (FRR). These metrics are computed in the same manner for both individual unit tests and multiple unit tests under the majority voting framework. However, the interpretation of True Positives (TP), True Negatives (TN), False Positives (FP), and False Negatives (FN) slightly differs between these two settings.
The four metrics are formally defined as follows. Accuracy measures the proportion of correct predictions and is given by:
Accuracy=TP+TN TP+TN+FP+FN Accuracy 𝑇 𝑃 𝑇 𝑁 𝑇 𝑃 𝑇 𝑁 𝐹 𝑃 𝐹 𝑁\text{Accuracy}=\frac{TP+TN}{TP+TN+FP+FN}Accuracy = divide start_ARG italic_T italic_P + italic_T italic_N end_ARG start_ARG italic_T italic_P + italic_T italic_N + italic_F italic_P + italic_F italic_N end_ARG(3)
Precision quantifies the proportion of predicted positives that are actually correct:
Precision=TP TP+FP Precision 𝑇 𝑃 𝑇 𝑃 𝐹 𝑃\text{Precision}=\frac{TP}{TP+FP}Precision = divide start_ARG italic_T italic_P end_ARG start_ARG italic_T italic_P + italic_F italic_P end_ARG(4)
Recall (also known as True Positive Rate) measures the proportion of actual positives that are correctly identified:
Recall=TP TP+FN Recall 𝑇 𝑃 𝑇 𝑃 𝐹 𝑁\text{Recall}=\frac{TP}{TP+FN}Recall = divide start_ARG italic_T italic_P end_ARG start_ARG italic_T italic_P + italic_F italic_N end_ARG(5)
F1 Score is the harmonic mean of precision and recall:
F1 Score=2⋅Precision⋅Recall Precision+Recall F1 Score⋅2 Precision Recall Precision Recall\text{F1 Score}=\frac{2\cdot\text{Precision}\cdot\text{Recall}}{\text{% Precision}+\text{Recall}}F1 Score = divide start_ARG 2 ⋅ Precision ⋅ Recall end_ARG start_ARG Precision + Recall end_ARG(6)
False Acceptance Rate (FAR) measures the probability of a wrong solution being incorrectly accepted:
FAR=FP FP+TP FAR 𝐹 𝑃 𝐹 𝑃 𝑇 𝑃\text{FAR}=\frac{FP}{FP+TP}FAR = divide start_ARG italic_F italic_P end_ARG start_ARG italic_F italic_P + italic_T italic_P end_ARG(7)
False Rejection Rate (FRR) measures the probability of a correct solution being incorrectly rejected:
FRR=FN FN+TN FRR 𝐹 𝑁 𝐹 𝑁 𝑇 𝑁\text{FRR}=\frac{FN}{FN+TN}FRR = divide start_ARG italic_F italic_N end_ARG start_ARG italic_F italic_N + italic_T italic_N end_ARG(8)
The definitions of True Positives (TP), True Negatives (TN), False Positives (FP), and False Negatives (FN) are as follows. True Positives (TP) denote the number of correct solutions that are classified as correct, while True Negatives (TN) refer to the number of incorrect solutions that are classified as incorrect. False Positives (FP) represent the number of incorrect solutions that are classified as correct, and False Negatives (FN) are the number of correct solutions that are classified as incorrect.
The distinction between a single unit test and majority voting lies in the classification process. For a single unit test, the classification is directly determined by whether the unit test accepts or rejects a solution. For multiple unit tests under majority voting, a solution is classified as correct if it is accepted by the largest number of unit tests among all candidate solutions, while the remaining solutions are classified as incorrect. These definitions ensure the metrics are consistently applicable across both single and multiple unit test scenarios.
Appendix E Prompt for Data Synthetic Pipeline
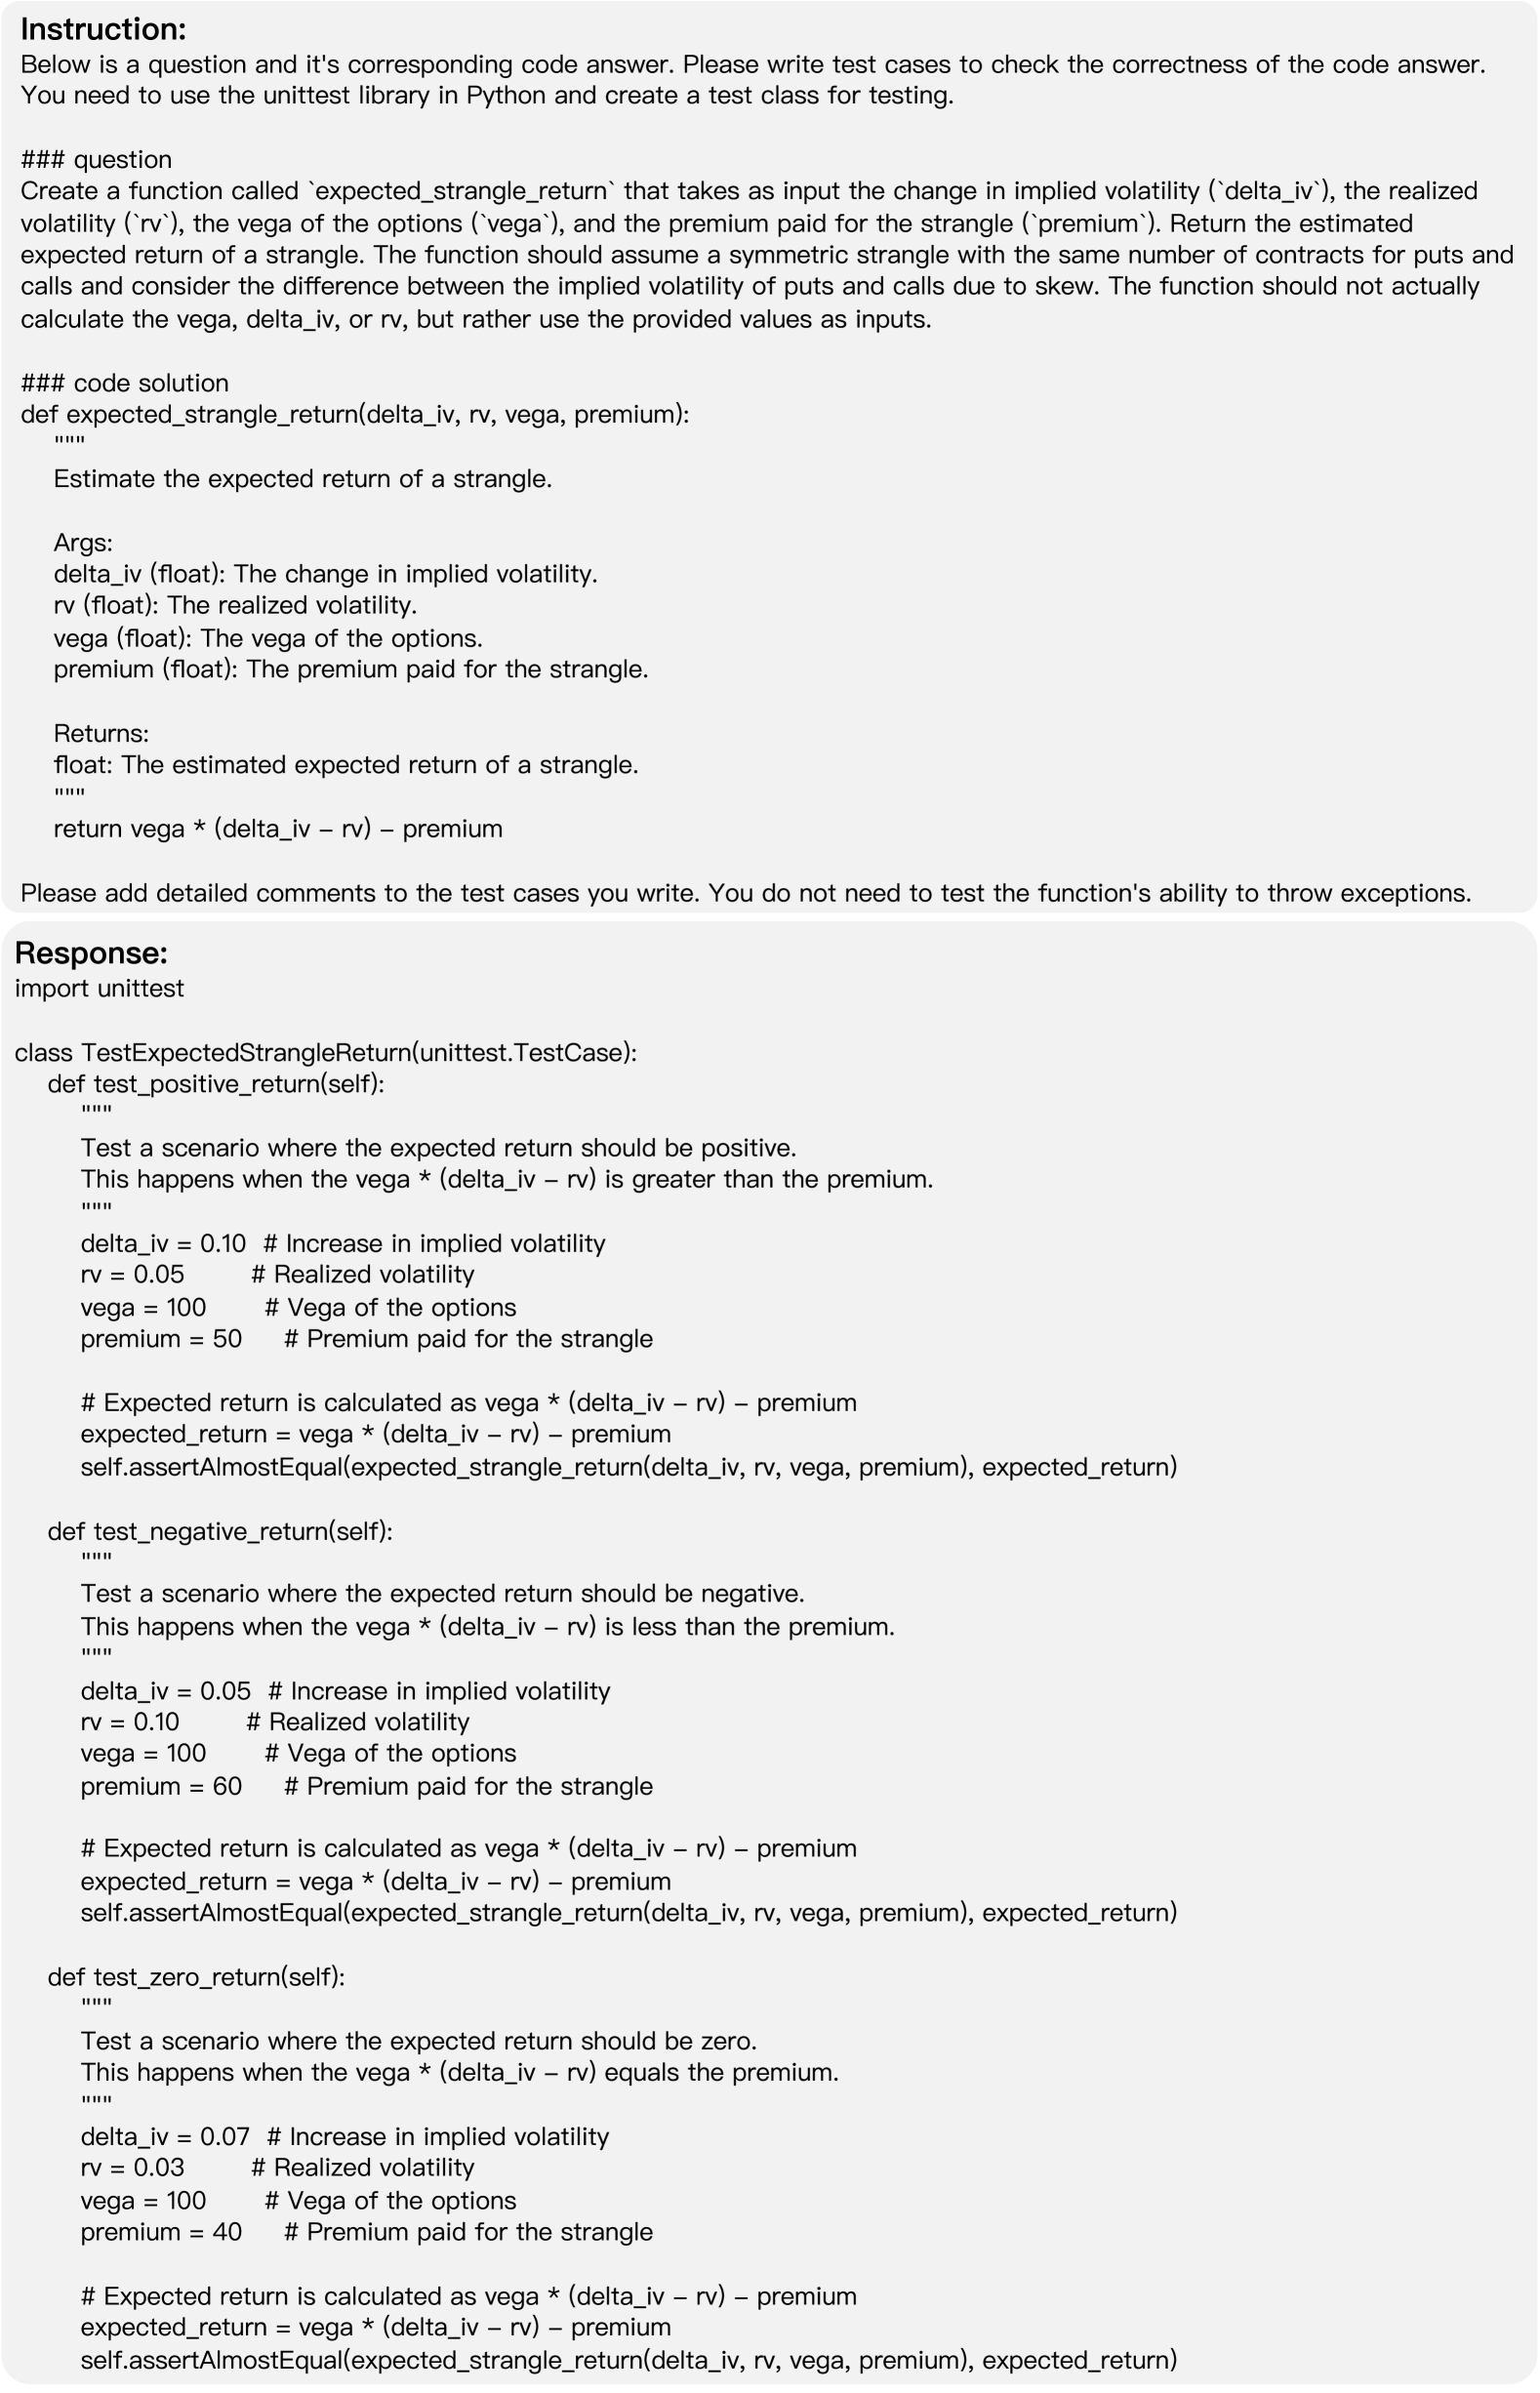
Figure 9: An example of the training data for the unit test generator.
Xet Storage Details
- Size:
- 68.7 kB
- Xet hash:
- 07675e7a880f575539517a222509f6a7120bd30827e6dc2d8a7480b6fe02b434
Xet efficiently stores files, intelligently splitting them into unique chunks and accelerating uploads and downloads. More info.