Buckets:


Title: Evaluating Scholarly Question Answering at Scale Across 75 Fields with Survey-Mined Questions and Rubrics
URL Source: https://arxiv.org/html/2509.00496
Published Time: Mon, 22 Dec 2025 01:51:21 GMT
Markdown Content:
Abstract
Evaluating long-form responses to research queries heavily relies on expert annotators, restricting attention to areas like AI where researchers can conveniently enlist colleagues. Yet, research expertise is abundant: survey articles consolidate knowledge spread across the literature. We introduce ResearchQA, a resource for evaluating LLM systems by distilling survey articles from 75 research fields into 21K queries and 160K rubric items. Queries and rubrics are jointly derived from survey sections, where rubric items list query-specific answer evaluation criteria, i.e., citing papers, making explanations, and describing limitations. 31 Ph.D. annotators in 8 fields judge that 90% of queries reflect Ph.D. information needs and 87% of rubric items warrant emphasis of a sentence or longer. We leverage ResearchQA to evaluate 18 systems in 7.6K head-to-heads. No parametric or retrieval-augmented system we evaluate exceeds 70% on covering rubric items, and the highest-ranking system shows 75% coverage. Error analysis reveals that the highest-ranking system fully addresses less than 11% of citation rubric items, 48% of limitation items, and 49% of comparison items. We release our data to facilitate more comprehensive multi-field evaluations.
{NoHyper}††footnotetext: ∗Equal contribution.
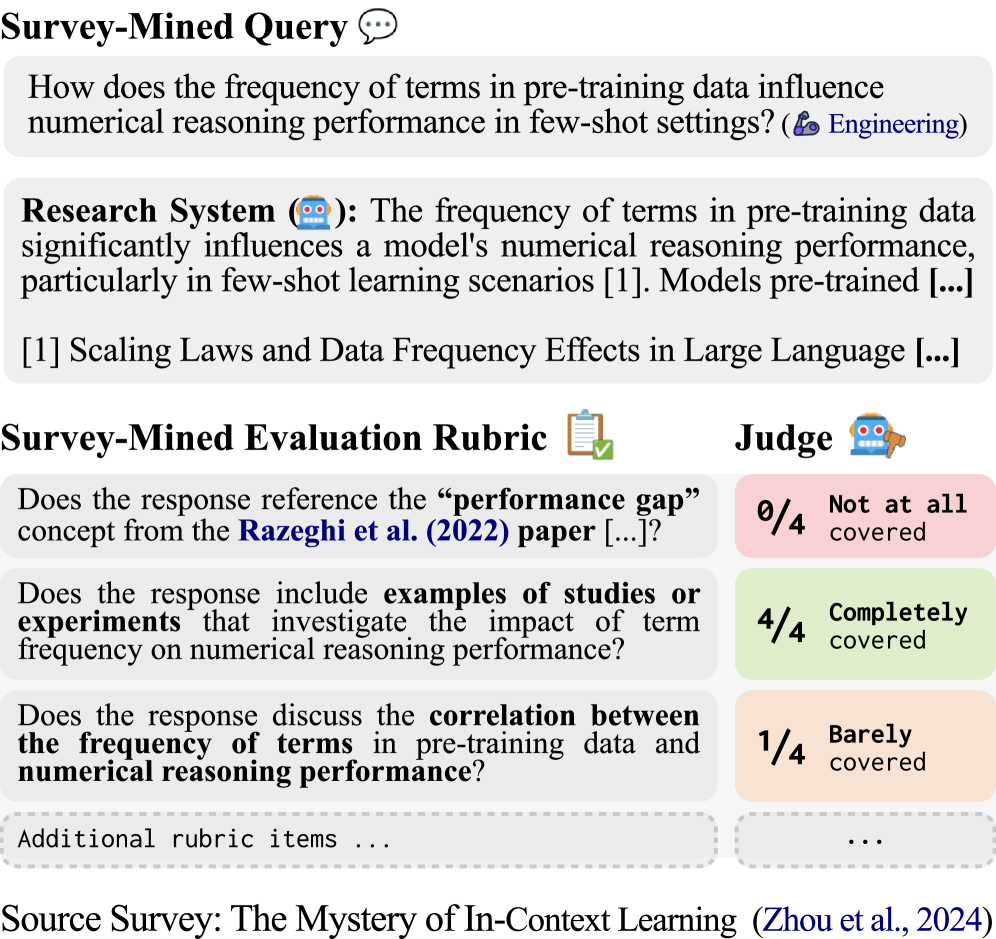
Figure 1: An example ResearchQA query and evaluation rubric. The query, mined from zhou-etal-2024, instructs a research system to generate a long-form answer. An automatic evaluator creates an absolute measure of answer quality via a rubric with up to 8 items. The first rubric item cites razeghi2022termfreq.
1 Introduction
The rapid growth in research literature makes staying informed about advancements in many fields difficult price1963little; larsen2010rate. Large language model (LLM) tools, such as deep research systems geminiGeminiDeep; openaiIntroducingDeep and scientific AI assistants skarlinski2024language; sciencediscovery; si2024llmideas; singh2025ai2, show potential to address this problem by meeting the information needs of both experts and non-experts. However, evaluating long form answers to research queries is extremely challenging kiwi. Several benchmarks have been proposed(i.a., qasa; sciqa; openscholar; sciarena), but are limited in size and primarily constrained to engineering domains (Table˜1). Broader evaluation is necessary, but, as yet, has been unachievable because of a lack of affordable availability of appropriate experts.
In this paper, we introduce ResearchQA, a literature-based resource for benchmarking research synthesis systems. Our insight is to leverage academic surveys, whose role is to review a research field’s foundational questions and synthesize relevant evidence kasanishi2023scireviewgen, for conveniently making comprehensive evaluation of research topics possible. We operationalize this idea by building a multi-stage pipeline to transform a pool of over 54K academic surveys into queries and answer evaluation rubrics lin2024wildbench; sawadaarb. Each rubric, derived jointly with queries by mining high quality survey sections, lists query-specific evaluation criteria, which may include citing papers, and making comparisons, or describing causal effects, among others (Figure˜1). To demonstrate the effectiveness of literature-based evaluation, we release ResearchQA, containing 21.4K queries with 160k rubric items, across 75 research fields, making it the most diverse and comprehensive benchmark of its kind to date(Tables˜1 and8).
We validate the quality of ResearchQA in a multi-field expert evaluation, spanning 31 Ph.D. level annotators with expertise from 8 fields. 90% of queries are judged as reflecting information needs of Ph.D. students and 86% are stylistically similar to how a Ph.D. student would have expressed that need. Few queries are considered too open-ended, facilitating the opportunity for criteria-based evaluation over open interpretation. We also evaluate the quality of rubric items, finding that 87% of them address concepts that should be covered in at least a sentence by systems.
We explore whether rubrics can improve LLM-as-a-Judge accuracy. We sample research queries and ask the same annotators to vote for the higher response quality between two retrieval-augmented systems. Expert preferences are aggregated using majority voting and find that human accuracy to these labels is 84%, which approximates an upper bound for LLM-as-a-Judge accuracy. Proprietary and open-sourced judges that directly predict preference show 71% and 64% accuracy respectively, likely because they lack appropriate expert knowledge. To bridge this knowledge gap, we score each response from 0 to 4 for each rubric item’s coverage(Figure˜1). To our excitement, we find that agreement increases to 74% and 69% when coverage and direct predictions are combined in an ensemble LLM-as-a-Judge protocol.
With ResearchQA, we extensively evaluate frontier systems, revealing significant performance gaps between how different inference pipelines address scholarly queries. We consider 18 systems across four tiers of test-time inference effort: language models using solely parametric memory, naive retrieval on Google Scholar, production-level retrieval optimized for consumer use, and deep research APIs. Each system is judged on two expert-validated evaluation metrics: (1) average rubric coverage %, and (2) Elo score using our ensemble LLM-as-a-Judge. The results reveal four noteworthy observations:
All systems struggle to cover rubric items. No parametric or retrieval system we evaluate exceeds 70% coverage. The highest-performing system we evaluate is Perplexity’s deep research perplexity2025deepresearch, with 75.29% coverage, indicating room for improvement.
Models selectively benefit from retrieval. When only relying on parametric memory, Claude-Sonnet-4 claude ranks lower than Gemini-2.5-Pro geminitwofive (30% win rate), but when both models use retrieval Claude-Sonnet-4 ranks higher (75% win rate).
Retrieval optimization is critical. We observe that a naive retrieval implementation is often insufficient to improve coverage. On average, the same models differ by 7.6% coverage between naive and production retrieval.
Deep research systems are significantly advantaged for scholarly queries. Strikingly, Perplexity’s deep research obtains 82% win rate over the next best system, revealing substantial gaps between the helpfulness of research-oriented tools.
Finally, we conduct an error breakdown of unaddressed rubric items, revealing that systems can improve across many criteria: common error cases include citing key works (under-addressed in 89% of cases), describing limitations (52% of cases), and making comparisons (51% of cases).
Scholarly QA Benchmark# Scholarly Queries# Scholarly Fields &Research Domains Abstractive Eval. Format Multi-Doc Reasoning Evaluation Rubrics Auto-Generated
QASPER(1)5.0K 1 (NLP ←\leftarrow![]() )✗Extractive✗✗✗
QASA(2)1.8K 1 (AI ←\leftarrow
)✗Extractive✗✗✗
QASA(2)1.8K 1 (AI ←\leftarrow![]() )✗Extractive✗✗✗
PubMedQA(3)1.0K— (
)✗Extractive✗✗✗
PubMedQA(3)1.0K— (![]() )✗Yes/No✗✗✓
SciQA(4)2.5K 1 (CS ←\leftarrow
)✗Yes/No✗✗✓
SciQA(4)2.5K 1 (CS ←\leftarrow![]() )✗Extractive✗✗✓
KIWI(5)0.2K 1 (NLP ←\leftarrow
)✗Extractive✗✗✓
KIWI(5)0.2K 1 (NLP ←\leftarrow![]() )✓Abstractive✓✗✗
SciDQA(6)2.9K 1 (AI ←\leftarrow
)✓Abstractive✓✗✗
SciDQA(6)2.9K 1 (AI ←\leftarrow![]() )✗Extractive✓✗✓
SciQAG(7)188.0K 20 (C&MS ←\leftarrow
)✗Extractive✓✗✓
SciQAG(7)188.0K 20 (C&MS ←\leftarrow![]() )✗Extractive✗✗✓
ScholarQABench(8)3.0K— (
)✗Extractive✗✗✓
ScholarQABench(8)3.0K— (![]()
![]()
![]() )✓Abstractive✓✓✗
SciArena†(9)8.2K— (
)✓Abstractive✓✓✗
SciArena†(9)8.2K— (![]()
![]()
![]()
![]()
![]()
![]()
![]() )✓Abstractive✓✗✗
ResearchQA(Ours)21.4K 75 (
)✓Abstractive✓✗✗
ResearchQA(Ours)21.4K 75 (![]()
![]()
![]()
![]()
![]()
![]()
![]() )✓Abstractive✓✓✓
)✓Abstractive✓✓✓
Table 1: Comparison of ResearchQA to related benchmarks. Icons: ![]() Health Sciences & Medicine;
Health Sciences & Medicine; ![]() Life & Earth Sciences;
Life & Earth Sciences; ![]() Engineering & CS;
Engineering & CS; ![]() Physical Sciences;
Physical Sciences; ![]() Social Sciences;
Social Sciences; ![]() Humanities;
Humanities; ![]() Economics. (1)qasper; (2)qasa; (3)pubmedqa; (4)sciqa; (5)kiwi; (6)scidqa; (7)sciqag; (8)openscholar; (9)sciarena (†Concurrent work). Scholarly fields are marked as blank “—” when field descriptions are incomplete or metadata are missing.
Economics. (1)qasper; (2)qasa; (3)pubmedqa; (4)sciqa; (5)kiwi; (6)scidqa; (7)sciqag; (8)openscholar; (9)sciarena (†Concurrent work). Scholarly fields are marked as blank “—” when field descriptions are incomplete or metadata are missing.
2 ResearchQA: Mining Queries and Rubrics from Academic Surveys
To build ResearchQA, we create a multi-stage pipeline to generate queries and rubrics from survey articles (Figure˜2). We describe the selection of top publication venues in Section˜2.1 and survey articles in Section˜2.2. We present query generation in Section˜2.3 and rubric generation in Section˜2.4. Finally, we describe dataset splits in Section˜2.5. Further details about pipeline implementation are in Appendix˜A. To balance the cost and performance of pipeline creation, we select 𝓜\bm{\mathcal{M}}←\leftarrow gpt-4.1-mini whenever an LLM is used to generate or filter data. We discuss model alternatives in Appendix˜B and present a cost breakdown of different model 𝓜\bm{\mathcal{M}} alternatives for the data pipeline in Table˜10.
2.1 Extract Top Venues from Research Fields
To focus on high-quality surveys, we identify the top-20 publishing venues ranked by h5-index for each field in Google Scholar. Fields on Google Scholar can be overly specific (e.g., Wood Science & Technology) or general (e.g., Health & Medical Sciences (general)), so we manually redistribute from 257 to 94 fields. This process results in 660 venues that are used to retrieve survey articles.
2.2 Extract Survey Articles
We retrieve survey articles using keyword search on three sources: Crossref,1 1 1https://www.crossref.org/ Semantic Scholar,2 2 2https://www.semanticscholar.org and S2ORC s2orc. In total, 615K candidate articles are returned, 134K of which are downloadable full-text articles, and 54K which are automatically classified to represent a true survey article versus merely containing survey-related keyword(s) in the title.
Article search.
For each of 660 unique venues from Google Scholar, we retrieve publications with title keywords: survey, literature review, a review, an overview, and meta-analysis.
Article filters.
To optimize precision in our search, we apply filters to remove erroneous articles (e.g., survey can be used in the context of field observations, not literature reviews). We prompt 𝓜\bm{\mathcal{M}} to classify articles as literature reviews (F1==.80, Prec==.87), removing those judged not to be a literature review, i.e., work aimed at synthesizing and reviewing existing literature.
2.3 Generate Queries from Survey Content
We identify medium-length survey sections with multiple citations, then generate questions and reference answers using grouped sentences from each section. Queries are filtered by keywords and 𝓜\bm{\mathcal{M}} to ensure they are standalone and without excessive variability in appropriate answers (F1=.86, Prec=.75). In total, 319K of 886K sections are used, yielding 21K queries after filtering.
Survey section filters.
Sections are removed if section titles suggest they are not part of the main body (e.g., abstract). Next, we remove sections too short to be informative (<<3 sentences or <<800 characters), too long (>>300K characters), or lacking citations (<<3 inline citations).
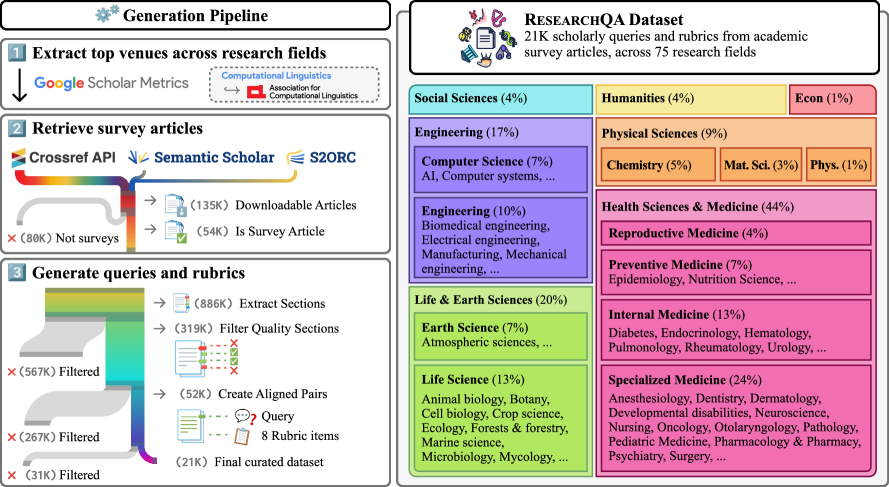
Figure 2: (Left) ResearchQA generation stages: We identify top-20 venues from each field in Google Scholar, retrieve survey articles from available databases, and generate queries and rubrics from survey sections. Throughout generation, we employ appropriate filtering mechanisms to ensure data quality. (Right) ResearchQA test split field distribution: Queries in the test split span 75 research fields from 7 domains, with high representation in Health Sciences & Medicine, Life & Earth Sciences, and Engineering.
Query and reference answer generation.
We few-shot prompt 𝓜\bm{\mathcal{M}} to extract hierarchical summaries christensen2014hierarchical from section content. Each summary consists of tree-based structure of questions with supporting sentences found in the section content benz2017questions; wu2023qudeval, helping to generate queries that integrate multiple sources of supporting information(Figure˜7). We prompt 𝓜\bm{\mathcal{M}} with examples, using section content and the summary to generate a query and reference answer. Prompts instruct that queries must be supported by at least 3 sentences and reference answers summarize supporting sentences without introducing new evidence. Like jansen2025matter, each query is paired with a knowledge cut-off date of the source article.
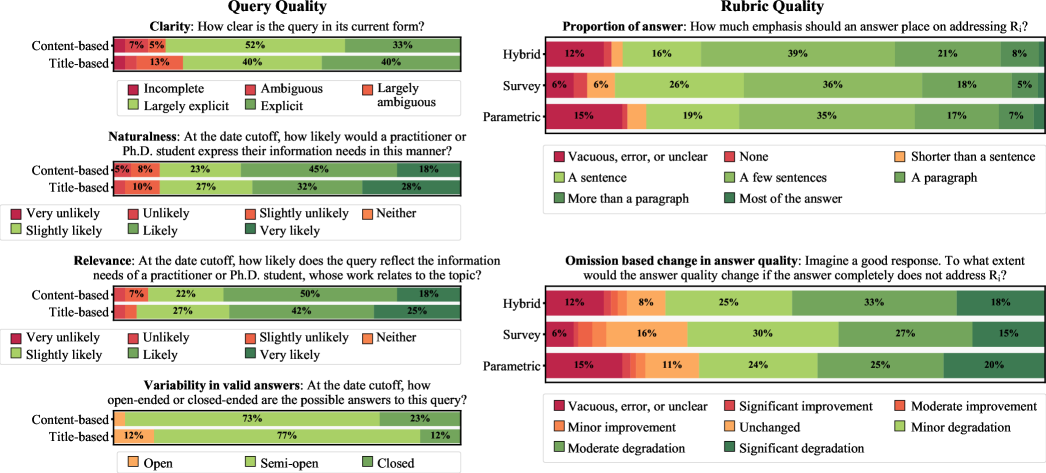
Figure 3: ResearchQA query and rubric quality ratings by 31 Ph.D. level experts.
Query filters.
We aim for queries that are (1)standalone, i.e., understandable by experts without extra decontextualization choi2021decontextualization; and (2)low in answer variability, i.e., different experts are likely to provide similar ratings so that model responses can be more easily scored. To enforce these criteria, we use 𝓜\bm{\mathcal{M}} to score standaloneness and answer variability of each query on a scale from 1 to 10. Queries scoring <<7 for standaloneness or >>4 for answer variability are removed.3 3 3 Thresholds validated by NLP experts on initial dev. data. Further, we discard queries that have keywords indicating context dependence (e.g., the paper, this study). We then remove queries with reference answers that are too short (<<800 characters). Finally, we re-apply 𝓜\bm{\mathcal{M}} to remove queries that are misassigned to a field, which can occur when mining queries from multi-field venues.
2.4 Rubric Generation
Rubrics 𝐑={R i}i=1 K\mathbf{R}={R_{i}}{i=1}^{K} consist of K K automatically generated rubric items R i R{i} that each evaluate aspects of answer quality. Below, we present the design choices and method for rubric creation.
Desiderata.
Rubrics are distilled from survey articles, adopting limitations from the articles themselves. For example, citations and analysis in the survey article can be subjective. Consequently, there may be gaps in evaluation criteria, e.g., an important missing R i R_{i}, and not all rubric items may be important. We address these potential limitations through two design choices. (1) We generate and evaluate three rubric types: survey rubrics (𝐑 S\mathbf{R}{S}), parametric rubrics (𝐑 P\mathbf{R}{P}), and hybrid rubrics that merge the two (𝐑 H\mathbf{R}{H}⊂\subset (𝐑 S\mathbf{R}{S}∪\cup 𝐑 P\mathbf{R}{P})), covering obvious gaps in rubrics wadhwa2025evalagent. (2) To create 𝐑 H\mathbf{R}{H}, we deduplicate, rerank, and remove hallucinations from the union set 𝐑 S\mathbf{R}{S}∪\cup 𝐑 P\mathbf{R}{P}, which intends to remove unimportant or flawed rubric items. The top-8 hybrid rubric items are retained, leaving ∼\sim 7.5 rubric items on average.
Rubric item generation.
We few-shot prompt 𝓜\bm{\mathcal{M}}, using question-answer pairs from ScholarQABench openscholar, to generate rubric items. 𝐑 S\mathbf{R}{S} is conditioned on both the query and reference answer; 𝐑 P\mathbf{R}{P} is conditioned on only the query. Each rubric item is created from one of three prompts designed to increase diversity of rubric item topics: information-based, depth-based, and citation-based items. Information-based items ask for specific statements, findings, opinions, or comparisons. Depth-based items ask for elaboration or explanation. Citation-based items ask whether answers cite a specific article. To create 𝐑 S\mathbf{R}{S} and 𝐑 P\mathbf{R}{P} with diverse items, we sample 4 information-based items, 2 depth-based items, and 2 citation-based items.
Hybrid rubric construction.
Using 𝓜\bm{\mathcal{M}}, we deduplicate repeating rubric items that represent identical criteria and rerank rubric items based on their importance for answer evaluation. To remove hallucinations, we remove rubric items referencing papers that cannot be automatically matched to a Google Scholar article. Post-filters, about 61% of hybrid rubric items come from 𝐑 S\mathbf{R}_{S}.
Baseline rubric construction.
We additionally compare against a generic rubric (𝐑 G\mathbf{R}_{G}) that does not take query specifics into account. Rubric items are sampled from ScholarQABench openscholar and SciArena sciarena metrics: Correctness, Citations, Coverage, Relevance, Organization, Usefulness, Attribution, and Examples. Table˜11 presents the full list of rubric items.
2.5 Dataset statistics and splits
We create train (𝒟 train\mathcal{D}{\text{train}}), validation (𝒟 validation\mathcal{D}{\text{validation}}), and test (𝒟 test\mathcal{D}{\text{test}}) splits. 𝒟 test\mathcal{D}{\text{test}} (3.7K queries) samples 50 queries from each field with ≥\geq 50 queries (75 of 94 fields), so that each field is sufficiently represented. 𝒟 validation\mathcal{D}{\text{validation}} (703 queries) samples up to 10 queries from remaining fields (74 of 75), and 𝒟 train\mathcal{D}{\text{train}} is made up by the remaining 16.9K queries, which are for supporting the community in developing and tuning research systems.
Section Annotation Type PA Section˜3.1Clarity.72 Naturalness.73 Relevance.83 Variability in Valid Answers.88 Section˜3.2Proportion of Answer.91 Omission Based Change in Answer Quality.94 Section˜3.3Rubric Coverage.73 Pairwise Preference.69
Table 2: Inter-annotator agreement across experts.
3 Expert Validation
This section presents the method and results of the expert validation study. We collect expert annotations for three judgement types: query quality (Section˜3.1), rubric quality (Section˜3.2), and scoring and preferences on system outputs (Section˜3.3). Judgements are made on Likert-scale and multi-category labels, visualized in Figure˜3, and are binarized by meaning for downstream analysis.
Annotator recruitment.
We recruited annotators via Ph.D. email lists. 45 Ph.D. students and 1 postdoctoral staff registered to participate in annotations, and 31 ultimately completed the annotation task. Annotators’ expertise span diverse fields: Natural Language Processing (15 experts), Computer Vision (6), Biomedicine (4), Linguistics (3), Physics (2), Genetics (1), Economics (1), and Psychology (1). Annotators were compensated $25 per hour of annotation.
Annotation agreement.
We measure inter-annotator agreement (IAA) as binary pairwise agreement (PA) in Table˜2. While tasks can be subjective, IAA is similar to prior work exploring expert judgements for scientific QA (e.g., pairwise preference is .69 vs .70 PA in openscholar).
3.1 Query Quality
Setup.
Queries are judged on clarity, naturalness, relevance, and variability in valid answers. We compare queries from our pipeline (content-based) against an ablated pipeline that generates solely from survey titles (title-based), controlling for comparisons on the same query topic. This analysis isolates the effect of pipeline components used to enhance query generation and filtering.
Label binarization.
We binarize labels by positive and negative meaning. Clarity merges Largely explicit and Explicit; Naturalness merges Slightly likely to Very likely; Relevance merges Slightly likely to Very likely; and Variability in valid answers merges Semi-open and Closed.
Survey content yields unambiguous queries, eliciting answers without too much variability.
Experts rate ∼\sim 85% of content-based queries as Largely explicit or Explicit, indicating that queries generated from our pipeline have mostly specific and easy interpretations. Likely, content-generated queries have specific interpretations due to grounding in a reference text. Additionally, content-based queries have more Semi-open or Closed-ended queries (96% versus 89%), which supports valid answers that can be directly compared. By contrast, Open-ended queries might elicit a large number of possible answers. For example, “What distinguishes robustness under distribution shift from domain adaptation and transfer learning in NLP?” can yield answers that experts find difficult to rank and compare.
Queries support the information needs of researchers and are naturally expressed.
Queries generated from both full and ablated pipelines have similar relevance and naturalness. 94-90% are rated as Slightly likely or stronger to reflect researchers’ information needs, and 86% of queries Slightly likely or stronger to be expressed in that way by a researcher. These ratings also indicate room for improvement, because queries rarely are rated as Very likely to be relevant or naturally expressed.
3.2 Rubric Quality
Setup.
Rubric items are judged on the number of sentences that should be used to address the item in an answer and how its omission affects answer quality (Figure˜3). Additionally, annotators can flag a number of errors of a rubric item R i R_{i}: (1) R i R_{i} is difficult to judge; (2) R i R_{i} is unclear; (3) R i R_{i} is an empty or unspecific assessment (e.g., it is a mere rephrasing of the query);4 4 4 A rule-based system is also employed to detect unspecific rubric items, where rubric items need to include at least one substantive word not present in the original query. (4) R i R_{i} contains an error (e.g., it cites a non-existent paper). The presence of any of these flags voids the quality of the rubric item. We compare among hybrid, survey, and parametric rubrics.
Label binarization.
In “Proportion of answer measurement”, we merge None and Shorter than a sentence. In “Omission based change in answer quality” we merge Significant improvement to Minor improvement.
Hybrid rubrics are likely to contain criteria worth describing in multiple sentences and improve answer quality.
Across rubric types, rubric items should be described in A sentence or more 84-86% of the time and their omission would degrade answer quality 69-74% of the time. Hybrid rubrics items are rated to be greatly important at a higher frequency, specifically those causing Moderate degradation or Significant degradation to answer quality when removed.
Hybrid rubrics contain few non-existent papers and vacuous restatements of the query.
Parametric rubrics have the highest rate of vacuous, error, or unclear items (15%). Experts note that parametric rubric items contain nonexistent paper titles, causing statements about their coverage in answers to be unanswerable or ambiguous.
3.3 System Output Preferences and Evaluation Protocol Validation
Setup.
We collect expert judgements on head-to-head answers (Figure˜8) to perform a meta-evaluation on LLMs using rubrics to approximate expert judgements. Experts provide two types of annotations: (1) Rubric coverage: Experts rate how well each answer covers each rubric item on a 5-point scale (0 = Not at all, 4 = Completely). (2) Pairwise preference: Experts compare two answers side-by-side (in random order) and select: Left is better, Right is better, Tie, or Both bad. Majority voting determines the final label.
Answers are generated from gpt-4.1-mini and gemini-2.5-flash using their providers’ embedding models 5 5 5 text-embedding-3-large, text-embedding-004 to retrieve relevant passages as input context. We retrieve the top-20 arXiv papers via Google search on the given query and constrain search by the appropriate date cutoff. Papers are chunked into 1000 character passages, and the top-20 passages ranked by embedding similarity score are input as context.
Label binarization.
Rubric coverage merges (0 = Not at all, 1 = Barely) and (2 = Moderately, 3 = Mostly, 4 = Completely). For pairwise preference, we drop Tie and Both bad, keeping only direction labels, i.e., Left or Right. PA are 0.73 and 0.69 respectively. Because agreement for pairwise preference is low, we collect up to 4 expert judgements and keep only those that had a majority voted direction label (89.7% of cases with direction judgements). Human annotators with direction label preferences have 84% accuracy agreement with the majority vote label.
Evaluator LLMs.
Open-source evaluators (prometheus-2-8x7b; prometheus-two) and proprietary LLMs (claude-4-sonnet and gpt-4.1-mini) are validated as automatic evaluators. For each evaluator, we compute agreement to expert annotations on rubric coverage and pairwise preference, which represent absolute and relative measures of answer quality respectively.
We prompt an LLM to produce rubric coverage in one call, inputting a system answer A A and rubric 𝐑={R i}i=1 K\mathbf{R}={R_{i}}^{K}_{i=1} to quantify the number of rubric items covered in A A on a 5-point scale, Coverage:A×𝐑→{0,1,2,3,4}K\mathrm{Coverage}:A\times\mathbf{R}\rightarrow{0,1,2,3,4}^{K}. The prompt describes the ends of the scale with labels from the user study (0 = Not at all, 4 = Completely).
We compare two types of automatic judges to predict pairwise preference. The Direct Judge (J direct\mathrm{J}{\text{direct}}) is prompted with the query and two system answers and asked “Which response is better?”. Both answer orderings are evaluated to reduce positional bias shi2024judging. However, direct comparison may lack appropriate knowledge useful to predict expert preferences. To address this gap, we introduce Ensemble Judge (J ensemble\mathrm{J}{\text{ensemble}}), which uses both J direct\mathrm{J}{\text{direct}} and Coverage\mathrm{Coverage} to predict preferred answers: the answer with a larger sum of Coverage\mathrm{Coverage} (0-4 scale) and a full 4 points for each J direct\mathrm{J}{\text{direct}} comparison, is marked as the preferred answer. Formally, this sum can be expressed as:
4(𝕀 A+𝕀 A′)+∑c∈Coverage(A,𝐑)c 4(\mathbb{I}{A}+\mathbb{I}^{\prime}{A})+\textstyle\sum_{c\in\mathrm{Coverage}(A,\mathbf{R})}c(1)
where 𝕀 A\mathbb{I}{A} indicates 1 if A A is preferred by J direct\mathrm{J}{\text{direct}} and 0 otherwise; 𝕀 A′\mathbb{I}^{\prime}{A} implements J direct\mathrm{J}{\text{direct}} with answers input in the reverse order. J ensemble\mathrm{J}_{\text{ensemble}}prefers the answer with the larger sum or outputs a tie.
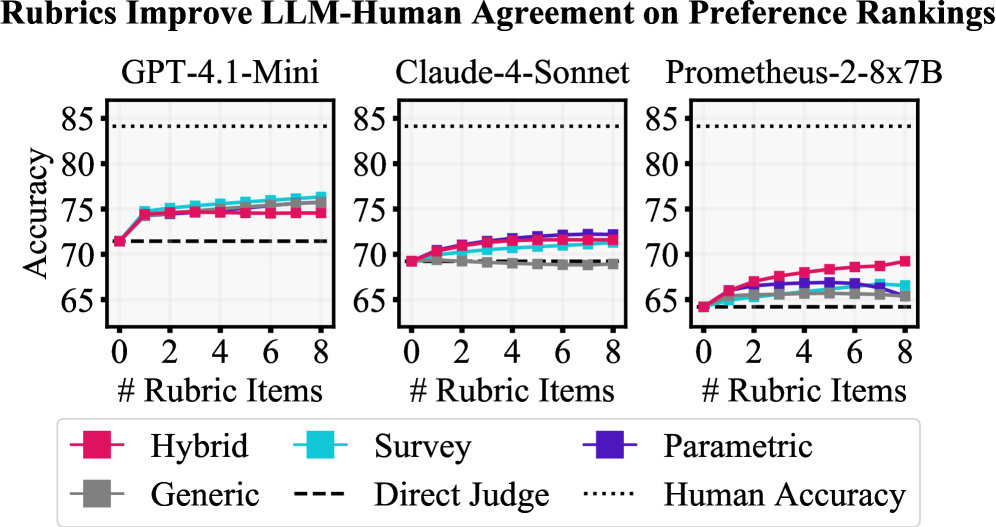
Figure 4: A comparison of how much rubrics can aid different evaluators in making predictions that agree with plurality human labels (y-axis) as a function of rubric size (x-axis). All direct judges benefit from integration of rubrics through the hybrid judge, substantially reducing their disagreement with human experts.
LLM-Human agreement on Rubric Coverage.
All evaluator LLMs show fair Pearson correlation with expert annotations on rubric coverage: prometheus-2-8x7b at .48, and both claude-4-sonnet and gpt-4.1-mini at .63. Averaged over our annotated data, experts and gpt-4.1-mini differ on Coverage\mathrm{Coverage} by only 0.11. On the other hand, gpt-4.1-mini tends to make more extreme predictions of Coverage\mathrm{Coverage} for individual samples. Experts rate a rubric items Completely covered 12.3% of the time while gpt-4.1-mini does so 26.0%. While a suitable judge on average, conclusions with gpt-4.1-mini may overestimate the frequency of some coverage values at the extremes.
LLM-Human agreement on Pairwise Preference.
We present the preference ranking accuracies of evaluator LLMs with respect to majority labels in Figure˜4. Each graph presents a base direct judge and the results of ensembling with the four types of rubrics we consider. In cases where judges predict ties, we assign partial credit.6 6 6 We have 3 cases of partial credit: (1) for the direct judge, if 𝕀 A≠𝕀 A′\mathbb{I}{A}\neq\mathbb{I}^{\prime}{A} , 50%, (2) if 𝕀 A\mathbb{I}{A} or 𝕀 A′\mathbb{I}^{\prime}{A} is correct and the other reports tie, 75%, and (3) if J ensemble\mathrm{J}{\text{ensemble}}reports tie, 50%. Human-Human accuracy agreement indicates an upper bound of 84% for LLM-Human agreement. Ensemble judges (J ensemble\mathrm{J}{\text{ensemble}}) are consistently better estimators of expert preferences than direct judges (J direct\mathrm{J}_{\text{direct}}), achieving up to ∼\sim 75% accuracy. Notably, rubrics can decrease the LLM-Human and Human-Human agreement gap from 12.7% to 9.6%, corresponding to a 24% relative reduction. In general, query-specific rubrics match or outperform generic rubrics. Hybrid rubrics demonstrate high performance gain across all systems, allowing prometheus-2-8x7b to match the direct judge performance of claude-4-sonnet. As visualized in Figure˜11, hybrid rubrics enhance evaluation in 7 of 8 fields, where they are the best-performing rubric in 4 of 8. The performance of parametric and generic rubrics depend on the strength of the evaluator: in strong evaluators, they can match hybrid rubrics, but they yield little to no benefit in open evaluators.
System Coverage%↑\uparrow Leaderboard Score↑\uparrow Avg Length(Words)
All domains![]()
![]()
![]()
![]()
![]()
![]()
![]() Parametric
Parametric
![Image 43: [Uncaptioned image]](https://arxiv.org/html/2509.00496v2/figs/providers/meta.png) llama-3.3-70b 53.42 ±\pm 0.26 51.82 54.21 54.89 55.74 53.91 53.22 58.10 617 ± 13 167.4
llama-3.3-70b 53.42 ±\pm 0.26 51.82 54.21 54.89 55.74 53.91 53.22 58.10 617 ± 13 167.4
![Image 44: [Uncaptioned image]](https://arxiv.org/html/2509.00496v2/figs/providers/anthropic.png) claude-4-sonnet 64.31 ±\pm 0.31 62.92 64.96 66.71 67.08 63.33 59.85 66.17 1099 ± 09 226.5
claude-4-sonnet 64.31 ±\pm 0.31 62.92 64.96 66.71 67.08 63.33 59.85 66.17 1099 ± 09 226.5
![Image 45: [Uncaptioned image]](https://arxiv.org/html/2509.00496v2/figs/providers/openai.png) gpt-4.1 65.43 ±\pm 0.25 63.98 66.84 66.66 67.38 65.45 63.48 68.46 1080 ± 09 241.5
gpt-4.1 65.43 ±\pm 0.25 63.98 66.84 66.66 67.38 65.45 63.48 68.46 1080 ± 09 241.5
![Image 46: [Uncaptioned image]](https://arxiv.org/html/2509.00496v2/figs/providers/qwen.png) qwen-3-32b 66.64±\pm 0.26 65.13 67.76 68.25 69.24 65.96 64.32 69.62 1038 ± 09 219.3
qwen-3-32b 66.64±\pm 0.26 65.13 67.76 68.25 69.24 65.96 64.32 69.62 1038 ± 09 219.3
![Image 47: [Uncaptioned image]](https://arxiv.org/html/2509.00496v2/figs/providers/google.png) gemini-2.5-pro 68.84±\pm 0.25 67.42 70.20 69.82 71.86 68.28 65.83 72.06 1244 ± 10 267.1
Retrieval (Naive)
gemini-2.5-pro 68.84±\pm 0.25 67.42 70.20 69.82 71.86 68.28 65.83 72.06 1244 ± 10 267.1
Retrieval (Naive)
![Image 48: [Uncaptioned image]](https://arxiv.org/html/2509.00496v2/figs/providers/ai2.png) openscholar-8b i 54.71 ±\pm 0.28 54.08 56.15 54.76 54.98 54.67 52.69 57.46 478 ± 17 499.9
gemini-2.5-pro ii 59.92 ±\pm 0.30 58.73 61.46 61.13 61.72 57.79 56.71 63.96 945 ± 10 270.4
qwen-3-32b iii 60.90 ±\pm 0.32 57.62 62.93 64.25 65.58 60.49 60.23 65.82 1011 ± 09 265.5
claude-4-sonnet iv 62.50±\pm 0.32 61.94 63.48 62.97 64.01 61.67 58.05 65.74 972 ± 09 238.4
gpt-4.1 v 64.80±\pm 0.29 63.69 66.65 65.11 66.72 64.25 62.09 66.33 1020 ± 09 263.6
Retrieval (Production)
openscholar-8b i 54.71 ±\pm 0.28 54.08 56.15 54.76 54.98 54.67 52.69 57.46 478 ± 17 499.9
gemini-2.5-pro ii 59.92 ±\pm 0.30 58.73 61.46 61.13 61.72 57.79 56.71 63.96 945 ± 10 270.4
qwen-3-32b iii 60.90 ±\pm 0.32 57.62 62.93 64.25 65.58 60.49 60.23 65.82 1011 ± 09 265.5
claude-4-sonnet iv 62.50±\pm 0.32 61.94 63.48 62.97 64.01 61.67 58.05 65.74 972 ± 09 238.4
gpt-4.1 v 64.80±\pm 0.29 63.69 66.65 65.11 66.72 64.25 62.09 66.33 1020 ± 09 263.6
Retrieval (Production)
![Image 53: [Uncaptioned image]](https://arxiv.org/html/2509.00496v2/figs/providers/perplexity.png) sonar 58.61 ±\pm 0.29 56.61 60.55 59.43 61.62 59.97 57.48 62.80 862 ± 10 242.2
openscholar-8b+feedback 58.72 ±\pm 0.32 57.77 59.96 58.62 61.48 57.27 57.29 62.48 769 ± 12 788.8
sonar-reasoning 64.33 ±\pm 0.31 62.73 66.00 65.19 68.11 62.68 61.76 67.49 1115 ± 10 280.5
gpt-4o-search-preview 65.98 ±\pm 0.27 65.52 68.21 65.01 66.60 66.07 62.62 65.63 992 ± 09 255.0
gemini-2.5-pro+grounding 68.51±\pm 0.25 67.38 70.02 68.76 70.99 68.09 65.98 71.21 960 ± 09 278.5
claude-4-sonnet+ws 69.18±\pm 0.26 69.54 70.49 67.59 70.28 68.14 64.70 67.13 1149 ± 10 327.8
Deep Research
o4-mini-deep-research†72.69±\pm 0.54 74.02 73.58 70.57 74.04 73.25 68.99 74.54 1145 ± 10 271.6
sonar-deep-research 75.29±\pm 0.26 75.01 76.31 74.48 76.77 75.34 72.47 78.01 1505 ± 17 267.3
sonar 58.61 ±\pm 0.29 56.61 60.55 59.43 61.62 59.97 57.48 62.80 862 ± 10 242.2
openscholar-8b+feedback 58.72 ±\pm 0.32 57.77 59.96 58.62 61.48 57.27 57.29 62.48 769 ± 12 788.8
sonar-reasoning 64.33 ±\pm 0.31 62.73 66.00 65.19 68.11 62.68 61.76 67.49 1115 ± 10 280.5
gpt-4o-search-preview 65.98 ±\pm 0.27 65.52 68.21 65.01 66.60 66.07 62.62 65.63 992 ± 09 255.0
gemini-2.5-pro+grounding 68.51±\pm 0.25 67.38 70.02 68.76 70.99 68.09 65.98 71.21 960 ± 09 278.5
claude-4-sonnet+ws 69.18±\pm 0.26 69.54 70.49 67.59 70.28 68.14 64.70 67.13 1149 ± 10 327.8
Deep Research
o4-mini-deep-research†72.69±\pm 0.54 74.02 73.58 70.57 74.04 73.25 68.99 74.54 1145 ± 10 271.6
sonar-deep-research 75.29±\pm 0.26 75.01 76.31 74.48 76.77 75.34 72.47 78.01 1505 ± 17 267.3
Table 3: Performances of LLM systems in a pairwise tournament across domains (![]() Health Sciences & Medicine;
Health Sciences & Medicine; ![]() Life & Earth Sciences;
Life & Earth Sciences; ![]() Engineering & CS;
Engineering & CS; ![]() Physical Sciences;
Physical Sciences; ![]() Social Sciences;
Social Sciences; ![]() Humanities;
Humanities; ![]() Economics.) Retrieval embedding models belong to corresponding system providers: i openscholar-retrieve and openscholar-reranker; ii text-embedding-004; iii gte-qwen-2-7b-instruct; iv voyage-3-large; v text-embedding-3-large. †This system costs ∼\sim$1.15 per query, so statistics are only computed on answers sampled for tournament battles (∼\sim 20%).
Economics.) Retrieval embedding models belong to corresponding system providers: i openscholar-retrieve and openscholar-reranker; ii text-embedding-004; iii gte-qwen-2-7b-instruct; iv voyage-3-large; v text-embedding-3-large. †This system costs ∼\sim$1.15 per query, so statistics are only computed on answers sampled for tournament battles (∼\sim 20%).
4 LLM Systems Evaluation Setup
To benchmark top systems used for scholarly inquiry on ResearchQA, we evaluate 18 parametric, retrieval augmented, and deep research systems in both open-source and proprietary families (Table˜3) on 𝒟 test\mathcal{D}{\text{test}}. We perform all analyses with the best-performing rubrics (hybrid rubrics), evaluator LLM (gpt-4.1-mini), and protocol (J ensemble\mathrm{J}{\text{ensemble}}). We describe the task setup in Section˜4.1 and tournament setup in Section˜4.2.
4.1 Evaluation Task and Metrics
Task.
We consider the following task: systems are input a query Q Q and generate a citation-supported answer A A, constrainting on date D D and a response length L=L=,250 words. A sample answer is visualized in Figure˜9. This task design conservatively guards against potential biases from information recency, multi-turn clarification, and length biases rlhflengthbiases, trading off task naturalness. We explore more natural setups in section˜5.2, finding that D D can be presently discarded with low likelihood of bias. Further, we remove L L, allowing longer responses that may result from multi-turn interaction or no length specification.
Coverage %.
We compute average Coverage\mathrm{Coverage} over answers and divide by 4, normalizing the resulting percentage from 0% to 100%.
Leaderboard score.
Consistent with Chatbot Arena chatbotarena, we use the Bradley-Terry model bradley-terry-model for pairwise battles judged by J ensemble\mathrm{J}_{\text{ensemble}}, which is equivalent to the Elo equation elo. In case of ties, each system wins half the match. We report the median score from a 1000-iteration bootstrap and its standard deviation.
4.2 Tournament Details
We explore systems at a gradation of engineering effort: parametric, naive retrieval, production retrieval, and deep research.
Parametric systems.
We directly generate answers using default configs of API providers (OpenRouter 7 7 7https://openrouter.ai/ for open-source models).
Naive retrieval systems.
These systems represent retrieval with minimal engineering effort: language models conditioned on the top-20 retrieved passages. Each language model is paired with an embedding model from the same provider. We retrieve papers from a date-constrained Google Scholar search. For each query, up to 50 papers are retrieved: the top-20 using the query as search field, and an additional 10 for each of 3 related keywords generated by gpt-4.1-mini, a search method used in openscholar. Papers corresponding to distilled survey papers are removed to prevent unfair evaluation advantages due to data leakage. Each paper is chunked into 1000-token passages with 200 overlapping tokens of subsequent chunks, and the top-20 passages by embedding similarity score are used as context, optionally reranking when a cross-encoder reranker is available. We generate answers using the same decoding configurations as in the parametric setting and employ greedy decoding for OpenScholar.
Production retrieval systems.
These systems represent retrieval with advanced engineering effort, e.g., tool use, feedback, or refinement. We use default implementations in their respective repositories or APIs without modification.
Deep research systems.
At the time of writing, two commercial deep research systems have API access: OpenAI and Perplexity deep research. We use both APIs without modification.
Battle construction.
We construct a total of 7.6K battles, where each domain consists of a minimum of 1K battles and up to as many queries represented in the domain (1.8K for Health Sciences & Medicine). Each battle is constructed such that models are sampled uniformly (∼\sim 800 battles per model) and all model matchups are uniformly represented in each domain, ensuring connectivity of the comparison network.
Systems Avg Length Coverage % L L=250¬L\neg L Δ\Delta%L L=250¬L\neg L Δ\Delta Parametric qwen-3-32b 219.5 176.5−-19%66.8 64.0−-2.8 gemini-2.5-pro 268.5 241.4−-10%69.9 67.5−-2.5 Retrieval (Naive) claude-4-sonnet 238.9 299.5++25%63.6 62.8−-0.8 gpt-4.1 264.0 246.1−-6%65.0 63.7−-1.3 Deep Research o4-mini-deep-research 268.0 595.0++122%72.2 78.9++6.7 sonar-deep-research 267.2 1431.0++435%76.2 85.3++9.1
Table 4: Removing the L L=250 words length guidance prompt can affect average answer length (words). Longer answers tend to score higher coverage, because coverage is a recall-based measure. Analysis is performed on a 225 query subset of 𝒟 test\mathcal{D}_{\text{test}} (3 per field).
Item Type Description Example Frequency %Error % Citation X X is cited Does the response cite Kvaskoff et al. (2015) (title: […])that links endometriosis with elevated cardiovascular risk?8.3 89.3 Limitation Limitations of X X are mentioned Does the response address limitations of CTC in detecting small polyps and flat adenomas?2.7 52.4 Comparison X X and Y Y are compared Does the response compare reaction rates before and after catalyst saturation occurs?14.2 51.9 Example Examples of X X are mentioned Does the response include forage species (e.g., legumes,chicory) affecting lamb meat’s fatty acid profile?11.2 46.8 Impact Cause or impact of X X is mentioned Does the response mention the preservation of the anterior cruciate ligament (ACL) as a benefit of UKA?15.5 46.3 Other None of the above Does the response discuss METEOR’s fragmentation penalty and its role in evaluating word order?48.1 43.6
Table 5: Error rates for different rubric types, measured as the percentage of items not rated as Completely covered by the best-performing system (sonar-deep-research). Each rubric type provides a description (with X X representing a concept, method, or paper being evaluated) along with an illustrated example.
5 LLM Systems Evaluation Results
5.1 Response Results
Results by systems.
All systems struggle to fully cover rubric items, with no parametric or retrieval augmented systems we evaluated exceeding 70% coverage (Table˜3). The best-performing system sonar-deep-research reaches not much more, obtaining 75% coverage. These results demonstrate headroom for further improvement. Win-rates of different systems indicate large performance gaps: systems designed for research synthesis have large advantages over others. In fact, sonar-deep-research is estimated to have an 82% win rate over the next highest rated system, gemini-2.5-pro.
We visualize sample responses from each system category in Figure˜9 and Figure˜10, presenting a case study to show qualitative differences. Here, the question is: “What strategies are recent research efforts employing to reduce the wall-clock training time for BERT models? (Date: 2020-10-02)”. The parametric response covers sensible methods for training optimization (mixed-precision training, gradient accumulation) addressing content mentioned in rubrics. However, the response lacks detail about each method. Naive retrieval locates and explains in detail trainbigcompress, describing that the most effective recent strategies involve training larger models for fewer steps. The response hardly addresses prototypical explanations to the query, scoring lower coverage on the rubric. We further compare production retrieval and deep research for the query, “How does substrate temperature influence the crystal orientation and quality of AlN (002) thin films during sputtering? (Date: 2020-10-19)”. While the production retrieval response appears sensible, the deep research answer mentions the same explanations (atomic mobility) while uniquely discussing further aspects of temperature influences (stress evolution) in detail (<300°C [increases] residual stress up to 1.2GPa). In general, we find that deep research systems cover prototypical explanations while also dense in breadth and depth, demonstrating several advantages over systems from other categories.
Results by rubric type.
To identify areas for improvement, we break down coverage of rubric items addressing different types of evaluation criteria. Each rubric item is lemmatized, using NLTK nltk, and categorized using rules to 6 rubric types (Macro F1==.92, without “Other”). In Table˜5, we show examples and the distribution of sonar-deep-research errors. We report the proportion of rubric item types that are not Completely covered: citation-based items can be improved the most (89%), followed by describing important limitations (52%) and making comparisons (52%). Error breakdowns of all other systems are shown in Figures˜12 and13.
Results by domains.
Differences between domains are within ±\pm 6 Coverage % (Table˜3). While differences are small, Health Sciences and Humanities rank as the 2 lowest performing domains: in 10/18 systems for Health Sciences and 18/18 for Humanities. These trends are suggestive that evaluations focused on Engineering and Physical Sciences, which rank as top-performing domains and are also heavily represented in prior evaluations (Table˜1), provide an incomplete analysis of performance across research domains.
5.2 Effects of Information Recency, Survey Leakage, and Answer Length
In this section, we explore biases on Coverage % due to citing recent information, survey retrieval leakage, and constrained answer lengths.
Information recency analysis.
We examine whether relying on sources published after the distilled survey articles unfairly lowers Coverage %. For each answer, we count the % of cited sources that violate the instructed date cutoff (survey article publication year). Sources that violate the date cutoff make up ∼\sim 30% of the citations (Figure˜5), suggesting systems do not adhere to date cutoffs stated in instruction text. Despite high frequency of date violations, we observe that recent sources do not positively or negatively affect Coverage % in aggregate: Coverage % is on average ±1.3\pm 1.3% relative to mean coverage when there are no date violations. While current effects of date violations are small, we recommend monitoring possible information recency biases in future evaluations.

Figure 5: Rubrics are recent, mostly originating from surveys in the past decade. When cited sources violate date cutoff years, there is little bias on Coverage %.
Leakage analysis.
By distilling rubrics from downloadable survey papers, systems may gain evaluation advantages when retrieving the same survey papers to generate answers, i.e., leakage. To mitigate leakage from affecting evaluation, we restrict source papers from appearing in search retrievals in systems where appropriate control is possible. We additionally perform post-hoc leakage analysis, because many production systems do not have the option to restrict search retrieval for answer generation. Leakage is detected by checking whether the survey titles appears in the reference section of the answer.8 8 8 To address noise in paper titles, we lowercase text, remove special characters, and search for 6-gram matches. We compare Coverage % in subsets of answers where leakage is and is not detected for top-performing production systems in Table˜6 and all systems in Table˜13.
Leakage advantages are small and inconsistent: in 13 systems exhibiting leakage, Coverage % increased for answers with leakage in 8/13 systems, where Coverage % actually decreased in the other 5/13 systems. In aggregate, we observe increases of ∼\sim 1.1% when distilled surveys are retrieved to generate answers. These small differences assuage our concerns of leakage advantages in current systems, but evaluations of future systems should continue verifying that leakage advantages are minimal and restrict source surveys from search results whenever possible.
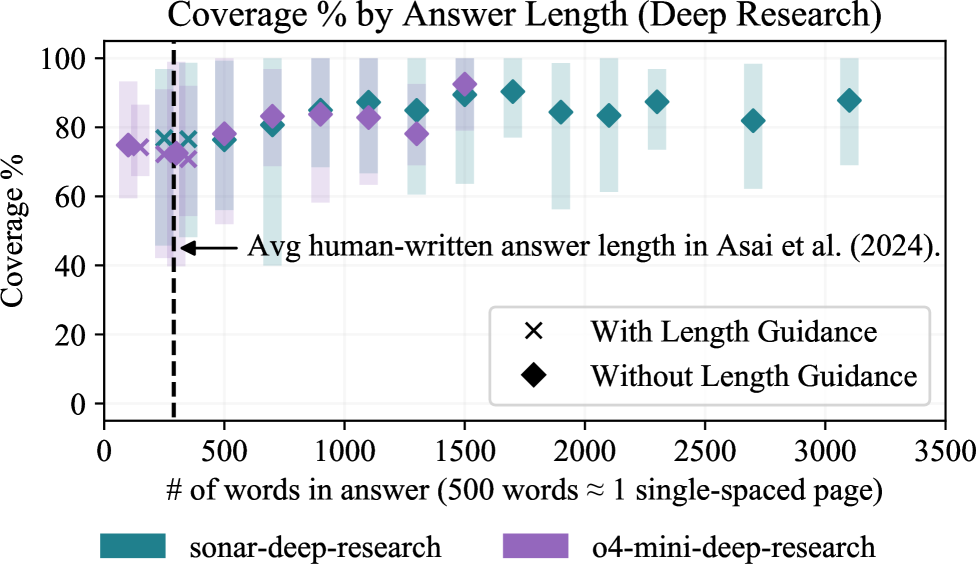
Figure 6: Coverage % increases with answer length, up until ∼\sim 2K words (about 4 pages of text).
System L%Coverage % ¬\neg Leaked Leaked Δ\Delta claude-4-sonnet+ws 30 71.27 68.30−-3.0 gemini-2.5-pro+grounding 2 66.91 68.54++1.6 o4-mini-deep-research 28 74.82 71.85−-3.0 sonar-deep-research 21 74.46 75.51++1.1
Table 6: Production systems often cite the related survey as a source, at 20-30% leakage (L%). However, Coverage % roughly stays the same with leakage (Leaked) and without leakage (¬\neg Leaked).
Unconstrained answer length analysis.
We remove the 250 word constraint from the task instruction text to further explore how Coverage%, a recall-based metric, increases when we do not control for answer length during evaluations. We select from the top performers for parametric, naive retrieval, and deep research systems by Coverage% and additionally generate answers for 3 queries per field (225 total queries). Average statistics are shown in Table˜4, and trends for deep research systems are visualized in Figure˜6 and for the remaining systems in Figure˜15.
Unconstrained length analyses reveal that many systems naturally generate answers of close to 250 words, with no substantial differences to answer length or Coverage % (Figure˜15). However, deep research systems tend to generate longer answers, up to 3K words (about 6 pages of text) per answer. By contrast, expert-written answers lengths for similar topics average 289 words in openscholar. Coverage % increases with answer length up to ∼\sim 2K words (about 4 pages of text), as shown inTable˜4, plateauing at 85% for sonar-deep-research and 79% for o4-mini-deep-research. These trends suggest that deep research systems are able to convey more helpful information while trading off concise and focused answers.
6 Related Work
We fit into a broad body of work trying to improve benchmarking for LLMs. This includes multi-domain works hendrycks2020measuring; wang2025mmlu, challenge sets rein2024gpqa; phan2025humanity; wolfson2025monaco and expert annotations expertqa; malaviya2025dolomites. Model development for survey creation has used survey data material goldfarb2020scalelitreview; kasanishi2023scireviewgen; agarwal2024litllm; wang2024autosurvey. Below we outline the key differences between ResearchQA and others.
Manually crafted scholarly benchmarks.
Manual curation of benchmarks for scholarly QA has encountered practical challenges for creating large, diverse, and complex datasets. QASPER qasper and QASA qasa limit their focus on queries that can be answered within a single paper. KIWI kiwi is built from questions derived by researchers on related work sections, and ScholarQABench openscholar recruited researchers to write questions from scratch. Both efforts have multi-document queries but are smaller than ResearchQA because of the challenges of recruiting researchers. Concurrently, SciArena sciarena leverages community contributions to collect queries and preferences; however, it remains smaller in size and coverage than ResearchQA and lacks evaluation rubrics.
Auto-generated scholarly benchmarks.
Automatically generated scholarly QA benchmarks trade-off scale for complexity and naturalness. DeepScholar-Bench patel2025deepscholar uses 63 CS papers to compare machine-written and human-written related works. SciQA sciqa is template generated and focuses on questions generated from knowledge graphs. PubMedQA pubmedqa generates queries from the abstracts of PubMed articles, but limits to yes or no questions. SciDQA scidqa extracts 188k queries asked during peer review on OpenReview but limits queries to extractions about the paper being reviewed. ResearchQA achieves more abstractive queries and evaluation materials by focusing on surveys but is smaller than SciDQA.
Evaluating long-form answers and rubrics.
A central problem for long-form answer evaluation is a large space of possible correct answers. Reference answers can be difficult to use, and token based measures like ROUGE lin2004rouge are gameable krishna2021hurdles. Recent efforts rely on direct evaluator LLMs openscholar; alpacaeval but may inherit self-preference llm-judge-self-bias-panickssery; llm-judge-self-bias-watoka, length biases alpacaeval and may be inaccurate for research queries. ResearchQA shows these judges can be effective. Rubric-based evaluations that decompose judgment into nuanced criteria sawadaarb; g-eval are promising alternatives to direct evaluator LLMs. Manually curated rubrics are often task-specific and small scale openscholar; starace2025paperbench; qin2024infobench. WildBench lin2024wildbench creates query-specific checklist rubrics from parametric memory at scale. EvalAgent wadhwa2025evalagent discovers query-specific rubrics with online search. Our rubrics leverage discovery from surveys, aligning them to expert-written material.
7 Conclusions
We introduce ResearchQA, a resource distilled from survey articles for large scale and multi-field evaluations of research synthesis. We leverage ResearchQA to benchmark 18 systems showing each has headroom for improvement. The highest-ranking deep research system, which achieves 82% win rate over the next system, only fully addresses fewer than 11% of items addressing citations, 48% of items describing limitations, and 49% of items asking about comparisons. ResearchQA can be expanded with newly written surveys as to increase coverage of new topics.
Limitations
While ResearchQA reduces reliance on experts, expert involvement is not eliminated. We depend on experts and expert-written articles to build and validate ResearchQA. To the extent that we can, we recruit experts to validate data, but not all fields are equally validated. Additionally, open access to research articles is limited, hindering exhaustive coverage of the literature. Rubrics distilled from these articles may not fully cover important criteria; we leave synthesis of larger and comprehensive rubrics for future work. Many recently released deep research systems involve limited access; their omission can distort leaderboard rankings and obfuscate important failure modes.
Acknowledgements
This research was developed with funding from the Defense Advanced Research Projects Agency’s (DARPA) SciFy program (Agreement No. HR00112520300) and the National Science Foundation Graduate Research Fellowship under Grant No. DGE-2236662. The views expressed are those of the authors and do not reflect the official policy or position of the sponsors. We would like to thank the UPenn NLP group and Material Science and Engineering, Biomedical Engineering, Computer and Information Science, Genetics, Linguistics, Physics and Astronomy, Criminology, and Psychology departments for generously participating in our annotation. We thank Zack Ives for aiding university wide recruitment.
Appendix A Additional Details of Dataset Pipeline
Below, we describe the data pipeline (Section˜2) details.
A.1 Query generation from survey articles
Curating a list of top publication venues for 257 research fields.
We identify the top-20 publishing venues for each of 257 research fields listed on Google Scholar Metrics (total venues == 4634). The aggregate counts are presented in Table˜7.
Retrieving survey articles from each publication venue.
We retrieve articles from three datastores: Crossref, the Semantic Scholar API, and S2ORC s2orc. Articles are queried with the following keywords: survey, literature review, a review, an overview, and meta-analysis. The article retrieval yields 615K article weblinks, where 134K are downloadable full-text articles.
Removing non-survey articles.
We use 𝓜\bm{\mathcal{M}} to classify between actual literature reviews and articles that mention a keyword like survey in its title. Classifier metrics are F1==.80, Prec==.87, Rec==.75 on an author-annotated validation set. The final yield is 54K survey articles across 254 research fields (3 research fields do not yield survey articles using our method).
Selecting sections from survey articles.
We apply a sequence of filters to select sections (total == 886K, yield == 319K) from survey articles:
- •Title passes keyword blacklist: We ignore abstract, introduction, or other summary sections, removing any sections that contain the following words: question, survey, abstract, introduction, contribution, related, result, discussion, conclusion, limitation, appendix, appendices, appendixes, supplementary, supplemental, supplement, material, acknowledgement, future, direction, summary, suggestion, table, tab., tbl., figure, fig., and plot.
- •Section length is not too short (≥\geq 3 sentences, ≥\geq 800 characters) and not too long (≤\leq 300K characters): We apply a basic length filter to ensure that queries are generated from substantial, but focused, sections.
- •Minimum number of in-text citations (≥\geq 3): We select sections that are well grounded in the literature, where each section must have 3 or more citations.
Field Fields Venues Business, Economics, & Management 16 285 Chemical & Material Sciences 17 318 Physics & Mathematics 21 370 Humanities, Literature, & Arts 26 481 Life Sciences 30 509 Social Sciences 31 526 Engineering & Computer Science 50 925 Health & Medical Sciences 66 1220 Total 257 4634
Table 7: Aggregated numbers for top-20 publishing venues in Google Scholar categories.
Research Domain and Field# Queries
Health Sciences & Medicine![]() 7454
Specialized Medicine 3968
Surgery 673
Pharmacology & Pharmacy 630
Dentistry 380
Oncology 369
Veterinary Medicine 332
Pediatric Medicine 294
Emergency Medicine 232
Psychiatry 208
Dermatology 189
Ophthalmology & Optometry 144
Developmental Disabilities 138
Anesthesiology 137
Otolaryngology 101
Nuclear Medicine, Radiotherapy& Molecular Imaging 89
Neuroscience 52
Preventive Medicine 2151
Nutrition Science 1410
Physical Education & Sports Medicine 327
Epidemiology 156
Alternative & Traditional Medicine 140
Tropical Medicine & Parasitology 118
Internal Medicine & Chronic Diseases 1070
Toxicology 196
Communicable Diseases 182
Endocrinology 124
Diabetes 118
Hematology 110
Urology & Nephrology 84
Pulmonology 76
Rheumatology 76
Gastroenterology & Hepatology 54
Vascular Medicine 50
Reproductive Medicine 265
Reproductive Health 95
Gynecology & Obstetrics 91
Pregnancy & Childbirth 79
Life & Earth Sciences
7454
Specialized Medicine 3968
Surgery 673
Pharmacology & Pharmacy 630
Dentistry 380
Oncology 369
Veterinary Medicine 332
Pediatric Medicine 294
Emergency Medicine 232
Psychiatry 208
Dermatology 189
Ophthalmology & Optometry 144
Developmental Disabilities 138
Anesthesiology 137
Otolaryngology 101
Nuclear Medicine, Radiotherapy& Molecular Imaging 89
Neuroscience 52
Preventive Medicine 2151
Nutrition Science 1410
Physical Education & Sports Medicine 327
Epidemiology 156
Alternative & Traditional Medicine 140
Tropical Medicine & Parasitology 118
Internal Medicine & Chronic Diseases 1070
Toxicology 196
Communicable Diseases 182
Endocrinology 124
Diabetes 118
Hematology 110
Urology & Nephrology 84
Pulmonology 76
Rheumatology 76
Gastroenterology & Hepatology 54
Vascular Medicine 50
Reproductive Medicine 265
Reproductive Health 95
Gynecology & Obstetrics 91
Pregnancy & Childbirth 79
Life & Earth Sciences![]() 4928
Life Sciences 3528
Agronomy & Crop Science 780
Forests & Forestry 674
Biochemistry 588
Microbiology 413
Botany 294
Animal Biology & Behavior 224
Cell Biology 190
Marine Sciences & Fisheries 188
Mycology 94
Ecology 83
4928
Life Sciences 3528
Agronomy & Crop Science 780
Forests & Forestry 674
Biochemistry 588
Microbiology 413
Botany 294
Animal Biology & Behavior 224
Cell Biology 190
Marine Sciences & Fisheries 188
Mycology 94
Ecology 83
Research Domain and Field (continued)# Queries
Earth Sciences 1400
Sustainable Energy 466
Hydrology & Water Resources 400
Geology 358
Geochemistry & Mineralogy 107
Atmospheric Sciences 69
Engineering & Computer Science![]() 4676
Engineering 3417
Materials Engineering 1944
Manufacturing & Machinery 329
Electrical Engineering 274
Biomedical Engineering 266
Architecture 240
Environmental & Geological Engineering 194
Ocean & Marine Engineering 88
Mechanical Engineering 82
Computer Science 1259
Artificial Intelligence 509
Signal Processing 274
Natural Language Processing 230
Computer Vision & Pattern Recognition 193
Computing Systems 53
Physical Sciences
4676
Engineering 3417
Materials Engineering 1944
Manufacturing & Machinery 329
Electrical Engineering 274
Biomedical Engineering 266
Architecture 240
Environmental & Geological Engineering 194
Ocean & Marine Engineering 88
Mechanical Engineering 82
Computer Science 1259
Artificial Intelligence 509
Signal Processing 274
Natural Language Processing 230
Computer Vision & Pattern Recognition 193
Computing Systems 53
Physical Sciences![]() 2544
Material Sciences 1320
Polymers & Plastics 1094
Composite Materials 226
Chemistry 1153
Analytical Chemistry 749
Chemical Kinetics & Catalysis 212
Dispersion Chemistry 134
Crystallography & Structural Chemistry 58
Physics 71
Physics 71
Social Sciences
2544
Material Sciences 1320
Polymers & Plastics 1094
Composite Materials 226
Chemistry 1153
Analytical Chemistry 749
Chemical Kinetics & Catalysis 212
Dispersion Chemistry 134
Crystallography & Structural Chemistry 58
Physics 71
Physics 71
Social Sciences![]() 1395
Sustainable Development 600
Public Health 566
Education 229
Humanities
1395
Sustainable Development 600
Public Health 566
Education 229
Humanities![]() 362
Cognitive Studies 301
Psychology 250
Language & Linguistics 51
Anthropology 61
Anthropology 61
Economics
362
Cognitive Studies 301
Psychology 250
Language & Linguistics 51
Anthropology 61
Anthropology 61
Economics![]() 55
Economics 55
55
Economics 55
Table 8: The number of queries for each of 75 fields, by research domain, in ResearchQA.
Type gpt-4.1-mini gpt-4.1 Q Q What is the rule-based approach in machine translation, and what are its benefits and limitations?How do rule-based machine translation systems use linguistic analysis and dictionaries to carry out translations? R 1 R_{1}Does the response provide a detailed explanation of the linguistic analysis process involved in the Rule-based Approach, including morphology, syntax, and lexical semantics?Does the response explain how linguistic analysis at multiple levels (morphology, syntax, lexical semantics) is used in rule-based machine translation? R 2 R_{2}Does the response discuss the flexibility of the Rule-based Approach in adapting to new language constructs by updating the dictionary?Does the response describe the use of bilingual dictionaries for mapping source language words to target language equivalents? R 3 R_{3}Does the response highlight the advantage of the Rule-based Approach in not requiring as many parallel sentence pairs as Neural Machine Translation?Does the response discuss how RBMT systems handle word ambiguities and parts of speech during translation? R 4 R_{4}Does the response mention the use of dictionaries and expert knowledge in establishing grammar rules for the Rule-based Approach?Does the response explore in depth how linguistic analysis at multiple levels (morphology, syntax, lexical semantics) is performed and integrated in rule-based machine translation systems? R 5 R_{5}Does the response include a definition or explanation of what a Rule-based Approach in machine translation is?Does the response provide a detailed explanation of how bilingual dictionaries are structured and utilized within the translation process? R 6 R_{6}Does the response mention specific benefits of using a Rule-based Approach in machine translation?Does the response provide a detailed explanation of how linguistic analysis components are integrated into the translation process? R 7 R_{7}Does the response highlight any limitations or challenges associated with the Rule-based Approach in machine translation?Does the response explore in depth the role and structure of dictionaries used in rule-based machine translation? R 8 R_{8}Does the response cite the paper by Scott and Barreiro (2009) (title: OpenLogos MT and the SAL representation language) that provides insights into the linguistic analysis and dictionary mapping process in Rule-based Machine Translation?Does the response cite papers like Kay (1980) (title: The Proper Place of Men and Machines in Language Translation) that discuss the integration of dictionaries with linguistic rules for accurate translation?
Table 9: Comparisons between when pipeline models are used as generators. Generally, queries and rubrics are comparable in quality, where those from gpt-4.1 are slightly more specific than those from gpt-4.1-mini.
Generating queries from survey sections.
We extract a date cutoff D D from each section’s article metadata, and we use 𝓜\bm{\mathcal{M}} to parse the section content into a hierarchical summary to generate an initial query and initial reference answer (Q initial,A^initial)(Q_{\text{initial}},\hat{A}_{\text{initial}}). To select high quality queries, all queries (total == 319K, yield == 21K) are filtered:
- •Initial query is self-contained: 𝓜\bm{\mathcal{M}} assigns Q initial Q_{\text{initial}} a self-containment score from 1 to 10, where higher scores indicate more self-containment. We remove queries with <<7.
- •Initial query has low answer variability: 𝓜\bm{\mathcal{M}} assigns Q initial Q_{\text{initial}} an answer variability score from 1 to 10, where higher scores indicate likely answer variability (e.g., expert disagreement or subjectivity). We remove queries with >>4.
- •(Rephrasing Step) Query and reference answer cohesion: 𝓜\bm{\mathcal{M}} rephrases (Q initial,A^initial)(Q_{\text{initial}},\hat{A}_{\text{initial}}) to queries Q Q and reference answers A^\hat{A} to improve their cohesion. We do not remove any queries at this step.
- •Query does not contain a citation: 𝓜\bm{\mathcal{M}} detects whether a citation is in the query Q Q.
- •Reference answer length is long enough (≥\geq 800 characters): Reference answers A^\hat{A} substantiate a semi open-ended query.
- •Final query is self-contained: After rephrasing, some queries are still not standalone, so we apply a keyword-based method to remove non-standalone queries. Keywords include past tense auxiliary verbs (did, was, were) or words in referring expressions (questionnaire, literature).
- •Final query is aligned with field: Venues can be multidisciplinary, and therefore some queries are unrelated to the field those venues are mapped to. To ensure field alignment, 𝓜\bm{\mathcal{M}} clasifies and removes queries that are unrelated to the field.
- •Queries are from a field with ≥\geq 50 queries: Queries should cover important aspects of a field, which is difficult to accomplish if there are not enough queries. We set 50 to be the minimum query count to call a field sufficiently covered by queries, which leaves 21K queries Q Q that cover 75 research fields.
A.2 Rubric generation from survey articles
We create rubrics with 𝓜\bm{\mathcal{M}}. To diversify rubric item types, three generation prompts are used—information, depth, and citation. These rubric types are intended to diversify the types of rubric items that are generated, whereas rubric items have been categorized post-hoc to more granular labels for analysis.
- •Information-based rubric item: A binary yes/no question asking whether an answer addresses a specific statement, finding, opinion, or comparison. Rubric items of this category allow for broad analysis of quality. Example: Does the response address the specific benchmarks where auto-regressive LMs outperform bi-directional encoders?
- •Depth-based rubric item: A binary yes/no question asking whether an answer elaborates or explains a topic. Rubric items of this category allow measuring analysis, discussion, and explanation in answers. Example: Does the response elaborate on the hybrid approach of GRIT in unifying auto-regressive and bi-directional features?
- •Citation-based rubric item: A binary yes/no question asking whether or not an answer cites a specific study. Rubric items of this category evaluate answer grounding in the literature. Example: Does the response cite papers such as Wang et al. (2023) (title: Improving text embeddings with large language models) and the MTEB paper (title: Massive Text Embedding Benchmark) that show the performance of auto-regressive LMs surpassing bi-directional encoders in retrieval tasks?
In addition to automatically generated rubrics, we explore generic rubrics using evaluation criteria from related work openscholar; sciarena. Generic rubric items are in Table˜11.
Remapping research fields and domains.
For the purposes of evaluation, some fields are overly specific (e.g., Wood Science & Technology) or overly general (e.g., Health & Medical Sciences (general)). Additionally, the Physics & Mathematics branch does not yield enough queries to sufficiently represent a domain. For these reasons, we redistribute data to match a more intuitive hierarchical structure. In total, we merge 170 of 257 fields and introduce 7 more: Animal Biology & Behavior, Biomedical Engineering, Electrical Engineering, Management, Mathematics, Physics, and Neuroscience. These changes result in a hierarchy covering 94 fields and 7 domains. Our pipeline is able to sufficiently cover 75 of 94 fields (where each of the 75 fields has ≥\geq 50 queries) using the available datastores. A full list of fields is in tabulated in Table˜8.
Model Queries Rubrics Total gpt-4.1-mini$ 349.65$ 133.65$ 483.30 gpt-4.1$ 1748.25$ 668.25$ 2416.50 gpt-4o$ 2185.31$ 835.31$ 3020.62
Table 10: Cost comparison for different pipeline models for the full generation of ResearchQA. All numbers are in batched inference pricing (2×\times cheaper).
Appendix B Pipeline Model Analysis
In this section, we discuss the performances and potential costs of different models 𝓜\bm{\mathcal{M}} used in the pipeline to create ResearchQA. We consider three state-of-the-art models at the time of consideration in Table˜10.
𝓜\bm{\mathcal{M}} as a classifier.
We use 𝓜\bm{\mathcal{M}} as a classifier for quality filtering, such as removing non-literature reviews, ambiguous queries, open-ended queries, and removing queries with citations. For each filtering task, we find that the smallest model, gpt-4.1-mini, obtains at least .80 F1 compared against author annotations.
𝓜\bm{\mathcal{M}} as a generator.
We show sample outputs from using gpt-4.1-mini and gpt-4.1 in Table˜9. We find that queries and rubrics generated by the two models are comparable in quality and content. Queries generated by gpt-4.1 are more specific, such as asking explicitly how linguistics and dictionaries are applied in rule-based machine translation; by contrast, gpt-4.1-mini asks for an open-ended explanation of rule-based machine translation with benefits and limitations. These differences propagate to the rubrics, with those from gpt-4.1 judging by discussion of word ambiguities and parts-of-speech whereas those from gpt-4.1-mini judge by data efficiency in rule-based methods (R 3 R_{3}). Overall, we find content similarities between model outputs with small differences in the fine-grained evaluation criteria.
Costs.
Costs for batched inference of 𝓜\bm{\mathcal{M}} are in Table˜10. Notably, gpt-4.1 is ∼\sim$2K more expensive than gpt-4.1-mini. Given performance similarities, we choose gpt-4.1-mini for scaling out ResearchQA.
Type Generic Rubric Item Correctness Does the response make factually correct statements? Citations Does the response cite relevant papers? Coverage Does the response provide sufficient coverage and amount of information? Relevance Does the response stay on topic and maintain a clear focus? Organization Does the response have an organized structure? Usefulness Does the response fulfill information needs? Attribution Does the response make correct citation-to-claim attributions? Examples Does the response include relevant examples?
Table 11: The generic rubric baseline, sampled from ScholarQABench openscholar and SciArena sciarena criteria. “Examples” is manually written to fill the rubric to 8 items.
System Model Card Additional settings Cost
Parametric
llama-3.3-70b llama-3.3-70b-instruct$5
claude-4-sonnet claude-sonnet-4-20250514$24
gpt-4.1 gpt-4.1$15
qwen-3-32b qwen3-32b$5
gemini-2.5-pro gemini-2.5-pro-preview-06-05$15
Retrieval (Naive)
openscholar-8b llama-3.1_openscholar-8b[Embed] openscholar-retriever[Reranker] openscholar-reranker$0
qwen-3-32b qwen3-32b[Embed] gte-qwen-2-7b-instruct$10
gemini-2.5-pro gemini-2.5-pro-preview-06-05[Embed] text-embedding-004$35
claude-4-sonnet claude-sonnet-4-20250514[Embed] voyage-3-large$218
gpt-4.1 gpt-4.1[Embed] text-embedding-3-large$151
Retrieval (Production)
sonar sonar$19
openscholar-8b+feedback llama-3.1_openscholar-8b$100
sonar-reasoning sonar-reasoning$38
gpt-4o-search-preview gpt-4o-search-preview search_context_size=medium$150
gemini-2.5-pro+grounding gemini-2.5-pro-preview-06-05 dynamic_threshold=0.3$30
claude-4-sonnet+ws claude-sonnet-4-20250514 tools.type=web_search_20250305 max_uses=3$450
Deep Research
o4-mini-deep-research o4-mini-deep-research tools.type=web_search_preview reasoning.summary=auto$4200
sonar-deep-research sonar-deep-research$1500
Table 12: LLM System Configuration and Cost. Default setting: temperature=0. Cost is for running on the full test set of ResearchQA (3750 queries). Organizations and related works: Meta grattafiori2024llama, Anthropic claude, OpenAI gpt4; openaiIntroducingDeep, Alibaba yang2025qwen3, Google geminitwofive; geminiGeminiDeep, AI2 openscholar, Perplexity perplexity2025deepresearch.
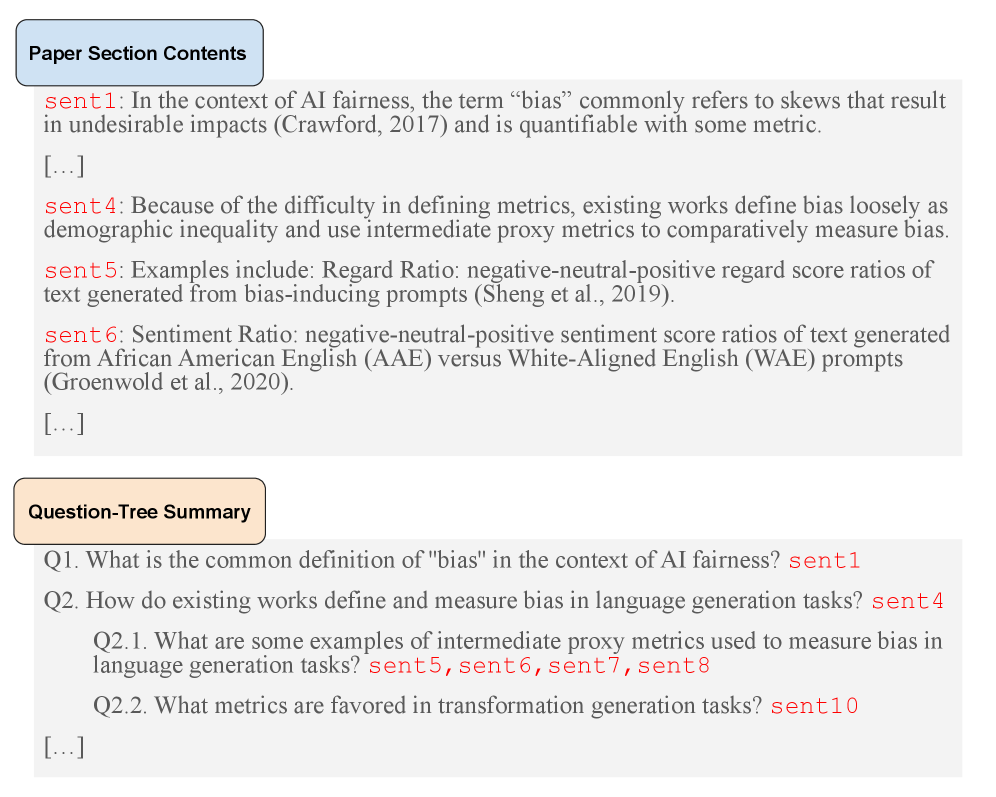
Figure 7: Hierarchical summary of section content, motivated by hierarchical summarization christensen2014hierarchical and question-under-discussion parsing benz2017questions; wu2023qudeval.
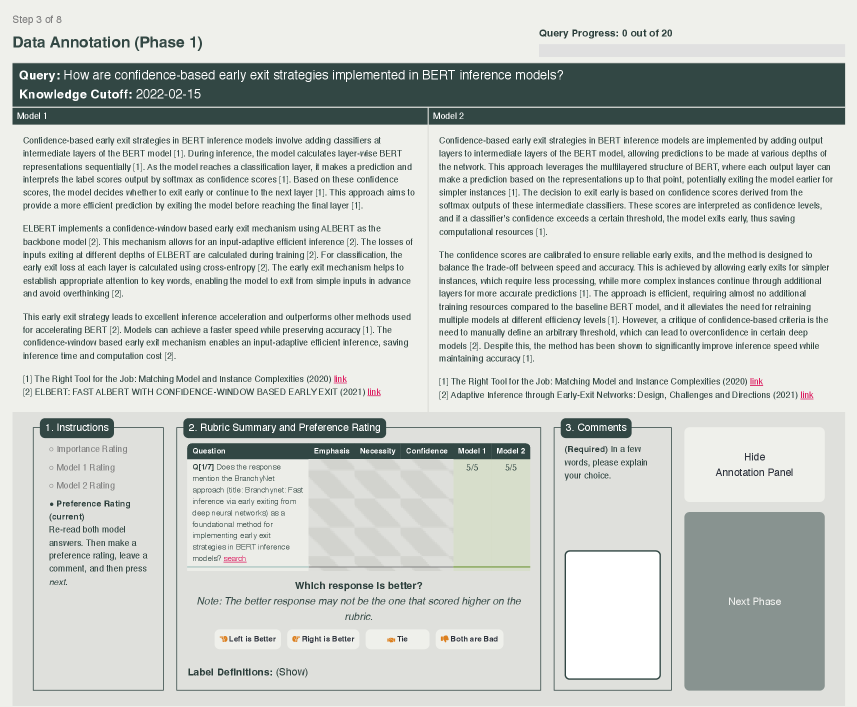
Figure 8: ResearchQA human evaluation interface.
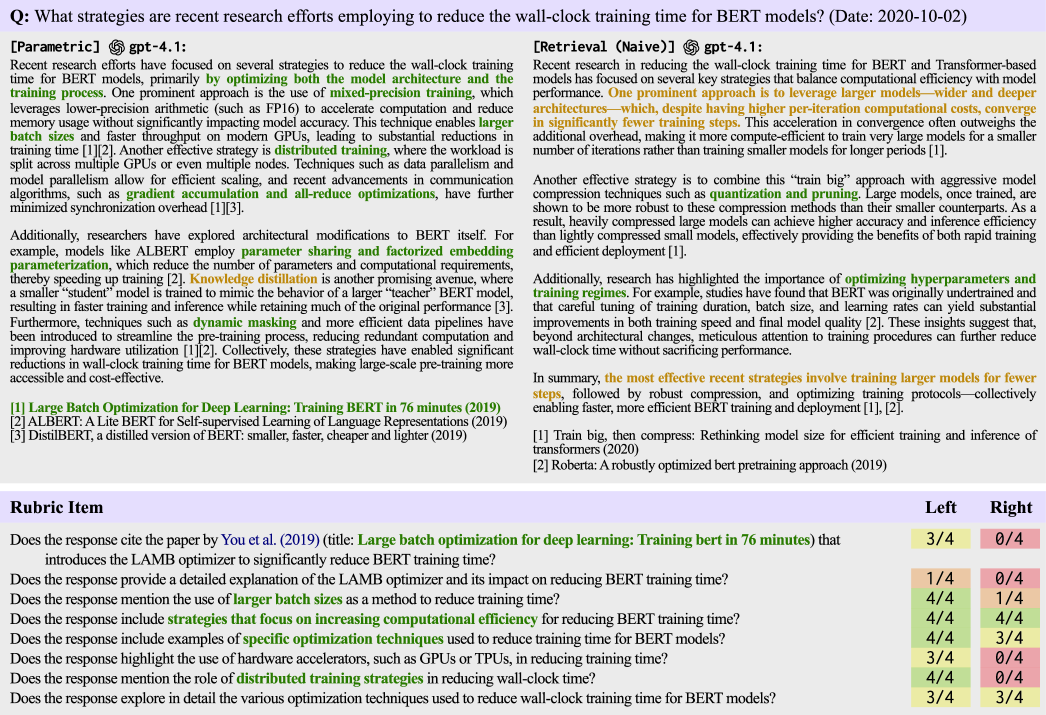
Figure 9: Retrieval-augmented responses can overly commit to orthogonal context, losing to parametric responses. Green text is content mentioned in the rubrics; Orange text is content generally not in the rubrics.
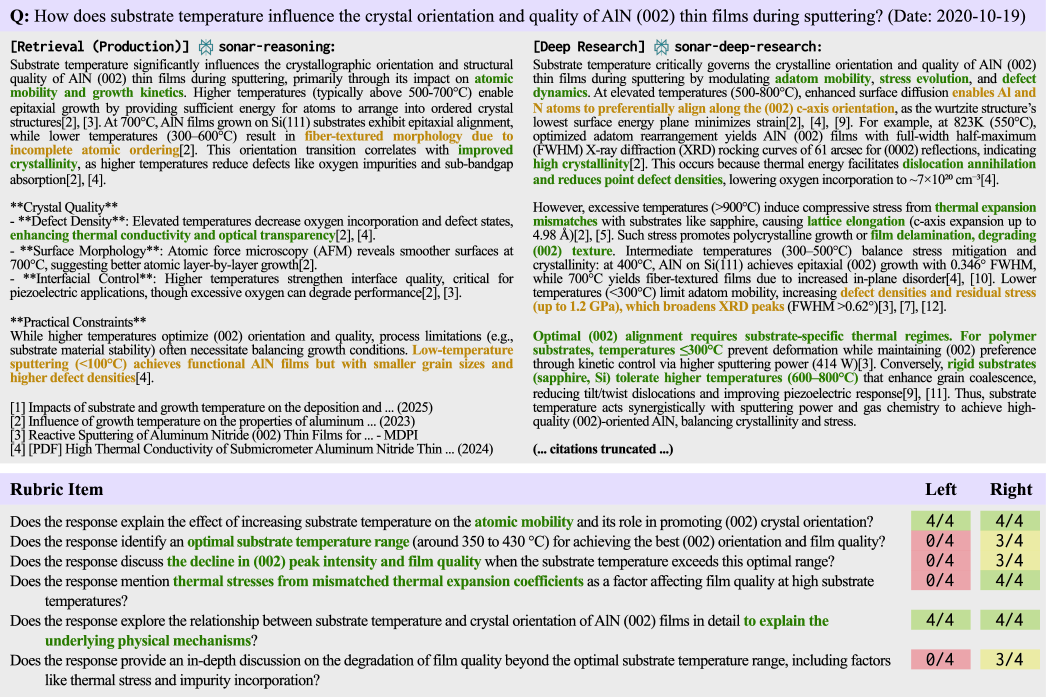
Figure 10: Deep research responses cover more concepts in greater detail. Green text is content mentioned explicitly in the rubrics; Orange text is content generally not explicit in the rubrics.
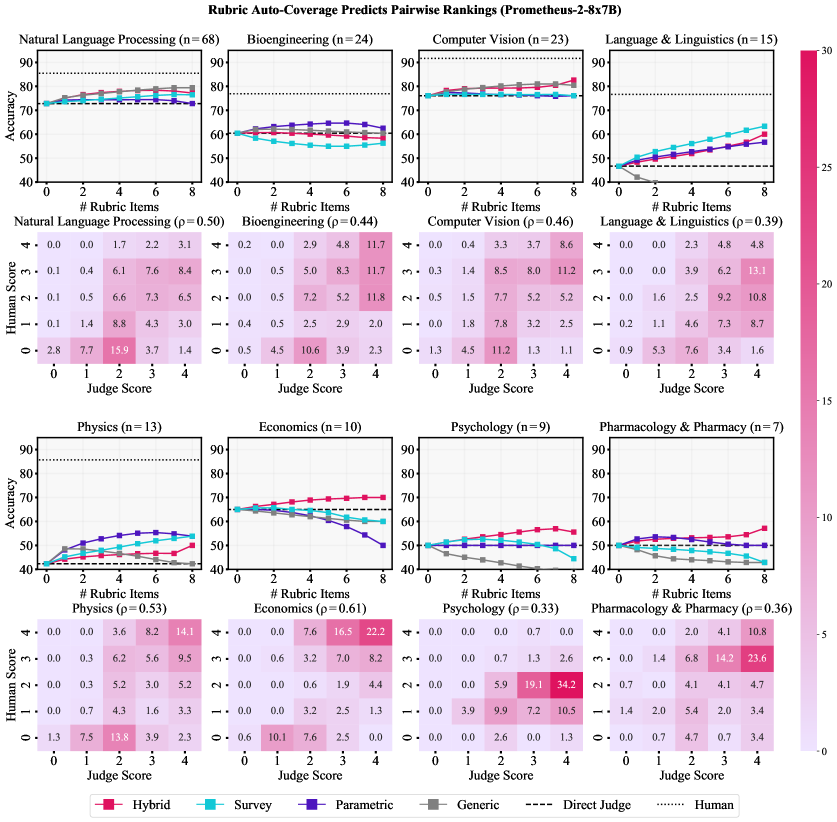
Figure 11: Rubrics used in ensemble judges can help to predict expert-labeled pairwise preference. Each graph represents fields covered by expert annotators. Heatmaps show confusion matrices of LLM and human rubric coverage scores. n n indicates the count of binary majority labels. In 7 out of 8 fields, hybrid rubrics can improve accuracy to majority labels, with hybrid rubrics obtaining highest performance in 4 out of 8.
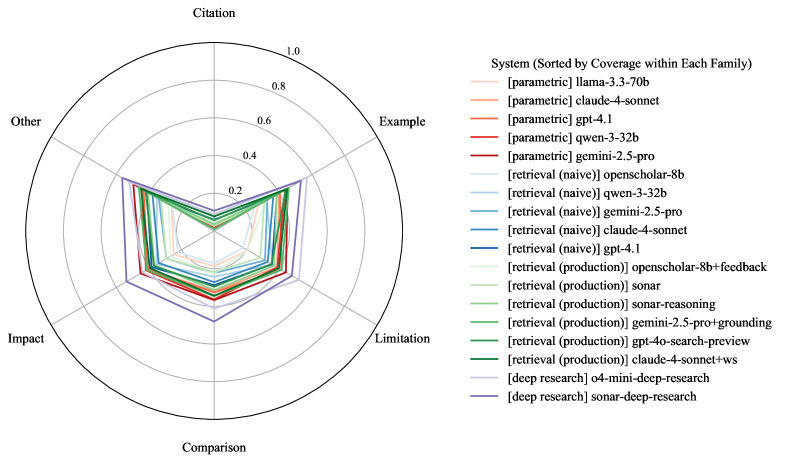
Figure 12: Comparison of LLM System Performance by Rubric Type (Radar). Performance is measured as the percentage of fully covered rubrics. Each rubric type is represented as an objective, with sonar-deep-research forming the Pareto frontier. “DR” denotes “Deep Research.”
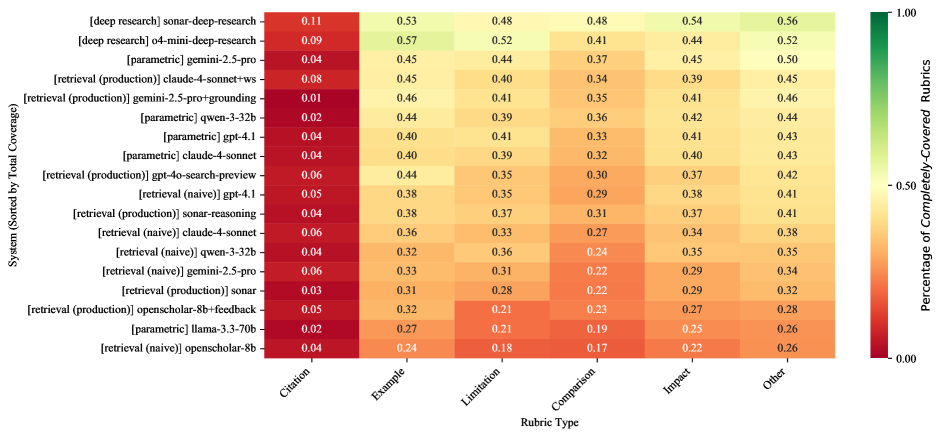
Figure 13: Comparison of LLM System Performance by Rubric Type (Heatmap). Performance is measured as the percentage of fully covered rubrics. Underperforming rubric types (x-axis) are shown for each system in the pairwise tournament (y-axis). “DR” denotes “Deep Research.”
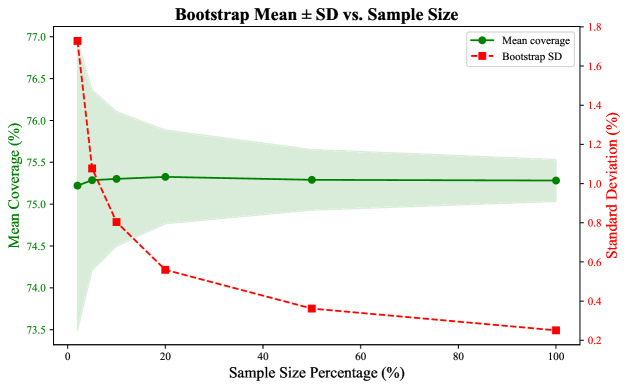
Figure 14: Coverage % is reliable at 20% sample size of 𝒟 test\mathcal{D}_{\text{test}}. Mean coverage and 95% bootstrapped confidence interval (green) and standard deviation (red) across varying sample sizes for sonar-deep-research. A 20% sample size (750 queries) can provide a stable estimate of rubric coverage with a standard deviation of approximately 0.6%, suggesting reliable approximation under budget constraints.
System Leakage %Coverage %
¬\neg Leaked Leaked Δ\Delta
Parametric
llama-3.3-70b 3 53.49 51.11−-2.4
claude-4-sonnet 4 64.44 61.21−-3.2
gpt-4.1 8 65.91 60.18−-5.7
qwen-3-32b 3 66.69 65.08−-1.6
gemini-2.5-pro 5 69.18 62.04−-7.1
Retrieval (Naive)
openscholar-8b 0 54.71——
gemini-2.5-pro 0 59.92——
qwen-3-32b 0 60.90——
claude-4-sonnet 0 62.50——
gpt-4.1 0 64.80——
Retrieval (Production)
sonar 18 58.84 57.50−-1.3
openscholar-8b+feedback 29 57.57 61.54++4.0
sonar-reasoning 22 64.21 64.77++0.6
gpt-4o-search-preview 27 65.30 67.81++2.5
gemini-2.5-pro+grounding 2 68.54 66.91−-1.6
claude-4-sonnet+ws 30 68.30 71.27++3.0
Deep Research
o4-mini-deep-research 28 71.85 74.82++3.0
sonar-deep-research 21 75.51 74.46−-1.1
Table 13: Retrieving the distilled survey does not provide large advantages toward higher Coverage%. Parametric systems have 3-8% leakage (L%); Retrieval (Naive) do not produce answers with leakage (likely because surveys are intentionally removed from their retrieval); Retrieval (Production) and Deep Research result in 20-30% leakage. Coverage % roughly stays the same with leakage (Leaked) and without leakage (¬\neg Leaked).
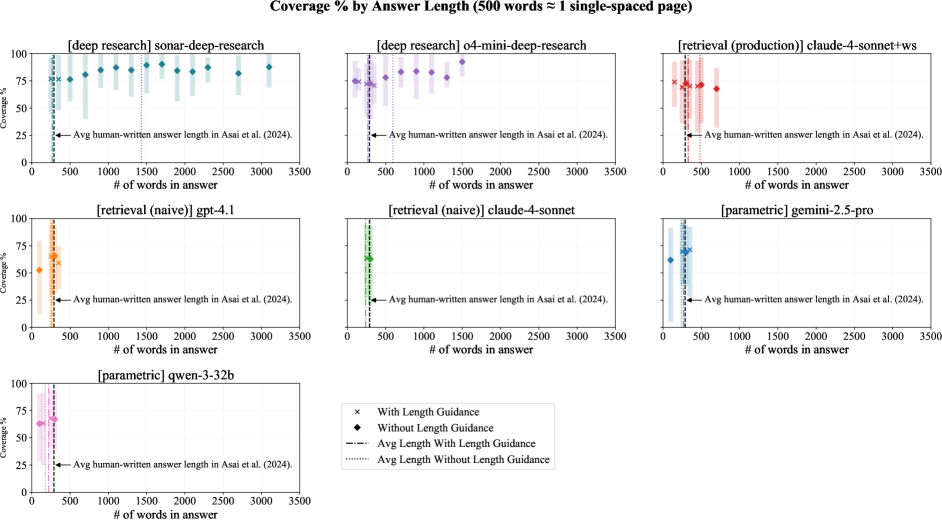
Figure 15: Coverage % vs. Length. The relation between Coverage % and answer length for the top performers in parametric, naive retrieval, and deep research categories selected by Coverage %, generating answers for 3 queries per field (225 total). Each subplot shows binned coverage across answer lengths, with markers distinguishing answers with vs. without length guidance. Vertical dashed lines indicate the average human-written answer length reported by openscholar; and Error bars represent 95% confidence intervals from bootstrap resampling.
Appendix C Model Prompts
C.1 Survey filtering prompt: is literature review
C.2 Query generation prompt: hierarchical summarization
C.3 Query generation prompt: generate initial query
C.4 Query filtering prompt: self-containment
C.5 Query filtering prompt: answer variability
C.6 Query filtering prompt: contains citation
C.7 Query generation prompt: generate initial reference answer
C.8 Query generation prompt: rephrase query and reference answer for cohesion
C.9 Parametric rubric generation prompt: information-based item
C.10 Parametric rubric generation prompt: depth-based item
C.11 Parametric rubric generation prompt: citation-based item
C.12 Survey rubric generation prompt: information-based item
C.13 Survey rubric generation prompt: depth-based item
C.14 Survey rubric generation prompt: citation-based-item
C.15 Rubric deduplication prompt
C.16 Hybrid rubric reranker prompt
Xet Storage Details
- Size:
- 98.2 kB
- Xet hash:
- 8d00d16eccdbd00fe8d98db315bd27fc83524955e7e781fd7e2a68b8bfd035b0
Xet efficiently stores files, intelligently splitting them into unique chunks and accelerating uploads and downloads. More info.