
AIOmarRehan/CNN_Audio_Classification_Model_with_Spectrogram
Audio Classification • Updated • 2
image imagewidth (px) 232 232 | label class label 13
classes |
|---|---|
0Baby cry | |
0Baby cry | |
0Baby cry | |
0Baby cry | |
0Baby cry | |
0Baby cry | |
0Baby cry | |
0Baby cry | |
0Baby cry | |
0Baby cry | |
0Baby cry | |
0Baby cry | |
0Baby cry | |
0Baby cry | |
0Baby cry | |
0Baby cry | |
0Baby cry | |
0Baby cry | |
0Baby cry | |
0Baby cry | |
0Baby cry | |
0Baby cry | |
0Baby cry | |
0Baby cry | |
0Baby cry | |
0Baby cry | |
0Baby cry | |
0Baby cry | |
0Baby cry | |
0Baby cry | |
0Baby cry | |
0Baby cry | |
0Baby cry | |
0Baby cry | |
0Baby cry | |
0Baby cry | |
0Baby cry | |
0Baby cry | |
0Baby cry | |
0Baby cry | |
0Baby cry | |
0Baby cry | |
0Baby cry | |
0Baby cry | |
0Baby cry | |
0Baby cry | |
0Baby cry | |
0Baby cry | |
0Baby cry | |
0Baby cry | |
0Baby cry | |
0Baby cry | |
0Baby cry | |
0Baby cry | |
0Baby cry | |
0Baby cry | |
0Baby cry | |
0Baby cry | |
0Baby cry | |
0Baby cry | |
0Baby cry | |
0Baby cry | |
0Baby cry | |
0Baby cry | |
0Baby cry | |
0Baby cry | |
0Baby cry | |
0Baby cry | |
0Baby cry | |
0Baby cry | |
0Baby cry | |
0Baby cry | |
0Baby cry | |
0Baby cry | |
0Baby cry | |
0Baby cry | |
0Baby cry | |
0Baby cry | |
0Baby cry | |
0Baby cry | |
0Baby cry | |
0Baby cry | |
0Baby cry | |
0Baby cry | |
0Baby cry | |
0Baby cry | |
0Baby cry | |
0Baby cry | |
0Baby cry | |
0Baby cry | |
0Baby cry | |
0Baby cry | |
0Baby cry | |
0Baby cry | |
0Baby cry | |
0Baby cry | |
0Baby cry | |
0Baby cry | |
0Baby cry | |
0Baby cry |
> This dataset was fully generated through my notebook > “Building an Audio Classification Pipeline with DL” available on my profile. > It represents a complete end-to-end transformation from raw audio to clean, balanced Mel-spectrogram images suitable for deep learning.
| Property | Description |
|---|---|
| Number of Classes | 13 distinct audio categories |
| Original Audio per Class | ~40 raw recordings |
| Average Duration | ~5 seconds per audio file |
| Final Images per Class | 125 Mel-spectrogram images |
| Final Dataset Size | 13 × 125 = 1625 images |
| Sampling Rate | Standardized to 16 kHz |
| Audio Length | Uniform 5-second fixed length |
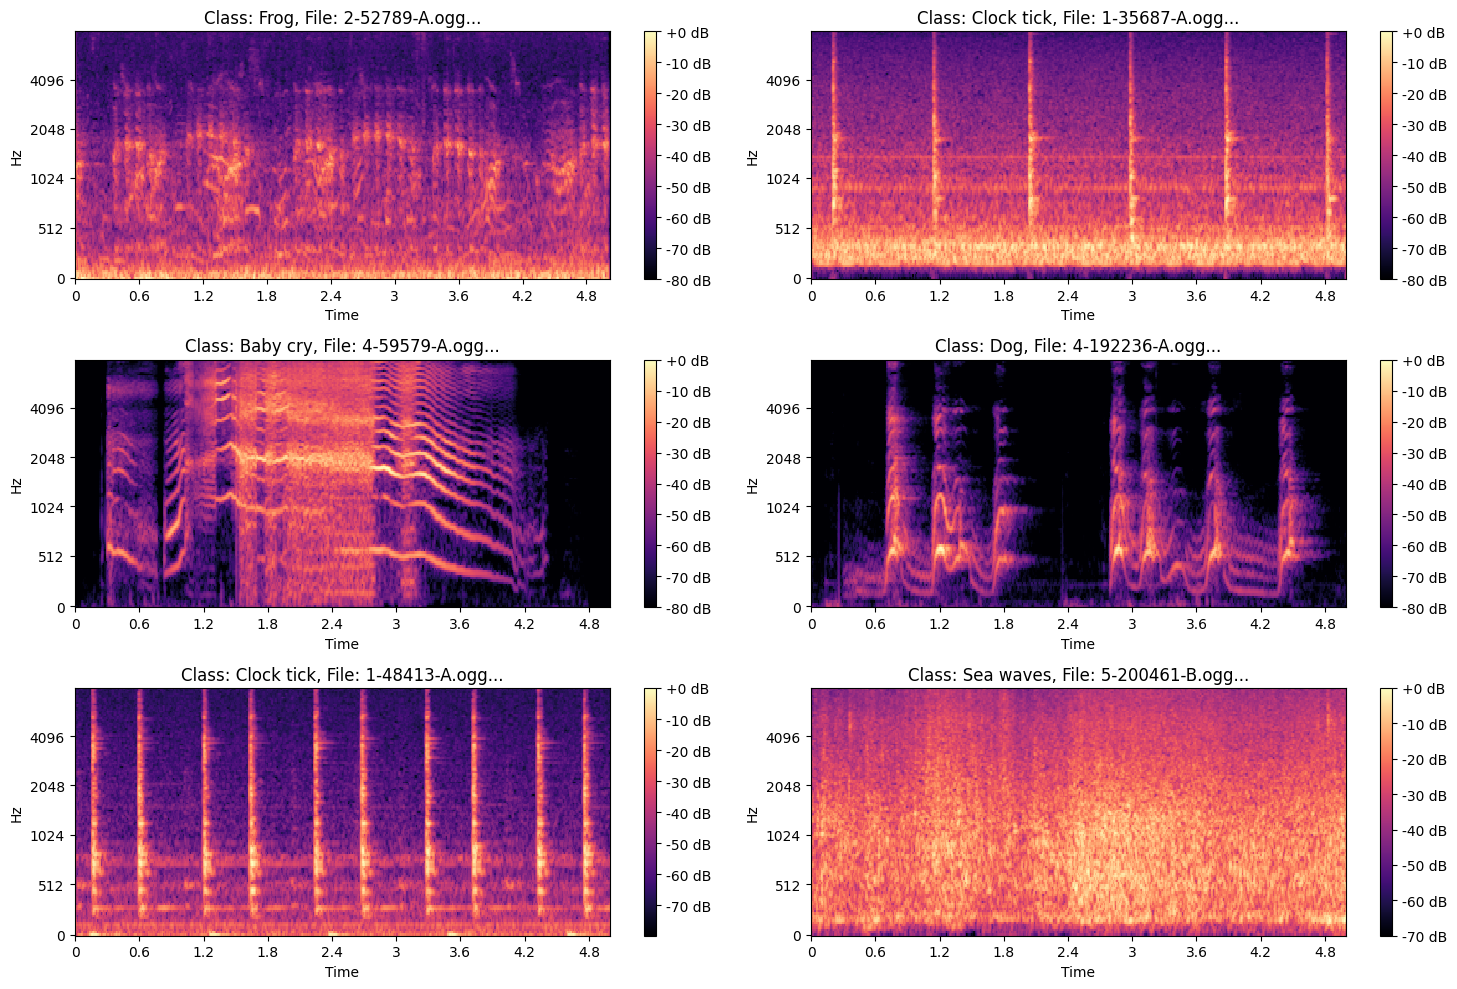
| Spectrogram Type | 128-Mel frequency bins, melspectrogram → dB |
The dataset was built using a fully custom preprocessing, cleaning, and augmentation pipeline, implemented step-by-step in the notebook.
librosa.effects.trimnoisereduce)Augmentations built with audiomentations:
Converted all cleaned audio files into Mel-spectrogram images using:
n_fft = 1024hop_length = 512n_mels = 128power_to_db)> “The final dataset consists of 13 audio classes, each expanded to exactly 125 Mel-spectrogram images through a rigorous pipeline of cleaning, normalization, augmentation, noise reduction, resampling, duration standardization, and feature extraction. All processing steps were implemented in my notebook ‘Building an Audio Classification Pipeline with DL,’ where raw 5-second audio recordings were transformed into high-quality Mel-spectrogram images suitable for deep learning models.”
.png?generation=1763570855911665&alt=media)
