

license: cc-by-4.0
Object Detection — Leaned vs Straight Poles
- This dataset contains real-world images of electric utility poles labeled as either "Leaned_Pole" or "Straight_Pole", It represents the initial stage in a broader effort to identify various defects in electric poles using machine learning.
- This module trains and evaluates a YOLOv12 model to detect Leaned_Pole vs Straight_Pole in field images.
Dataset Details
The dataset is organized into pre-split folders:
Poles_LeanedStraight/ObjectDetection/
├── train/
│ ├── images/
│ └── labels/
├── valid/
│ ├── images/
│ └── labels/
├── test/
│ ├── images/
│ └── labels/
└── data.yaml
Dataset Description
The dataset comprises 1804 real-world annotated images of electric poles collected across Visakhapatnam, Eluru, and Kakinada districts in Andhra Pradesh, India. These images were captured by utility linemen using mobile phone cameras during field inspections.
Each image has been annotated in YOLOv12 format with one of two labels:
Leaned_PoleStraight_PoleCurated by: Sampath Balaji & team, at APEPDCL
Funded by [optional]: Eastern Power Distribution Company of Andhra Pradesh Limited (APEPDCL)
Language(s) (NLP): Not Applicable
License: CC BY 4.0
Dataset Sources
- GitHub Repository (code): Direct Link
Uses
Direct Use
This dataset is intended to train, evaluate, and benchmark machine learning models for infrastructure monitoring, specifically for identifying leaned and straight poles in real-world, diverse conditions.
Out-of-Scope Use
- Surveillance or facial recognition tasks
- Biometric identification
- Any use that violates personal rights or local laws
Dataset Structure
- Total images: 1804
- Split:
- Train: 1444
- Validation: 181
- Test: 179
- Labels:
Leaned_Pole,Straight_Pole - Format: JPEG images with annotations in YOLOv12 format
- Augmentations: None applied
Dataset Creation
Curation Rationale
This dataset was created to build an ML pipeline for real-time defect detection in utility poles, starting with identifying leaned poles as a foundational task. The aim is to build an electrical line quality monitoring system to revolutionize maintenance workflows.
Source Data
Data Collection and Processing
Images were collected using mobile cameras by field linemen in Andhra Pradesh. All annotations were manually reviewed and labeled in YOLOv12 format.
Image Capture Protocol
The images were captured on the ground by APEPDCL linemen following a field protocol designed to reduce bias and ensure consistency:
- Linemen were instructed to hold the phone upright and parallel to the pole to avoid tilt or skew that could distort the pole's perceived angle.
- Images were to include both the top and bottom of the pole, as full visibility is essential for lean classification.
- No filters or enhancements were applied during capture.
Despite this protocol, many images were captured with a tilted horizon, making it difficult to determine if a pole was leaned or not. Tools like Google Photos and Adobe Lightroom were used to manually correct tilt by straightening the horizon.
To prevent this in future data, the team identified an open-source camera app, Open Camera, which uses the phone’s gyroscope sensor to auto-straighten images. This app is now recommended for field use to ensure more consistent alignment.
Observations and Future Protocol Improvements
During annotation, a key insight emerged:
- When images were taken too close to the pole, perspective distortion made it harder to determine pole alignment.
- Going forward, linemen will be instructed to stand approximately one pole height away to reduce distortion and improve labeling accuracy.
Who are the source data producers?
Electric linemen from APEPDCL working in Visakhapatnam, Eluru, and Kakinada districts of Andhra Pradesh, India.
Annotations
Annotation process
Manual bounding box annotations were created using image annotation tools and saved in YOLOv12 format. The team worked to maintain consistency, though some labeling errors may persist due to the manual nature of the task.
Who are the annotators?
The APEPDCL project team, under the direction of the team lead.
Personal and Sensitive Information
No personal or sensitive data was intentionally included. However, some images may contain people or faces captured incidentally in public areas, as the data was collected in outdoor settings.
Bias, Risks, and Limitations
- Geographic bias: All data comes from Andhra Pradesh, India — results may not generalize to other regions or environments.
- Scene/perspective bias: Variation in camera angles and distances may affect model training.
- Privacy risk: Images taken in public areas may contain identifiable people.
Recommendations
- Apply image normalization or augmentation techniques to improve generalization.
- Account for perspective and camera angle effects during training and evaluation.
- Use ethically and responsibly, especially in systems that affect public infrastructure.
Metrics on dataset:
Validation Results (conf 0.35)
| Class | Precision | Recall | mAP@0.5 | mAP@0.5–0.95 |
|---|---|---|---|---|
| Leaned_Pole | 0.894 | 0.894 | 0.963 | 0.730 |
| Straight_Pole | 0.914 | 0.875 | 0.934 | 0.572 |
| Overall | 0.904 | 0.884 | 0.949 | 0.651 |
Test Results (conf 0.35)
| Class | Precision | Recall | mAP@0.5 | mAP@0.5–0.95 |
|---|---|---|---|---|
| Leaned_Pole | 0.911 | 0.807 | 0.928 | 0.734 |
| Straight_Pole | 0.922 | 0.879 | 0.968 | 0.630 |
| Overall | 0.917 | 0.843 | 0.948 | 0.682 |
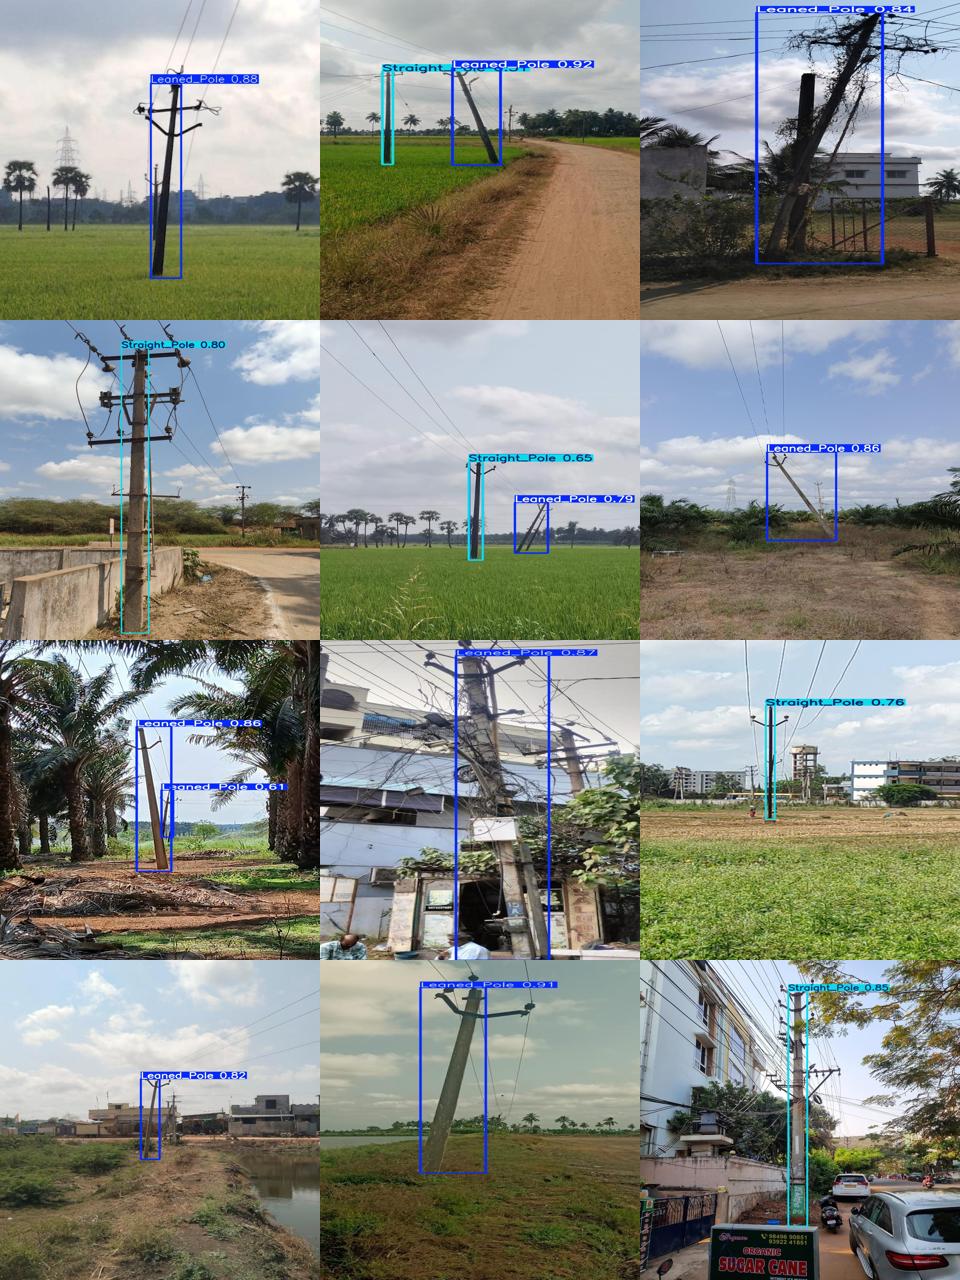
Sample predictions
More Information [optional]
Follow-up datasets in this series will include other electrical line and pole defects as part of APEPDCL's Line Quality monitoring project.