
Datasets:

prompt stringlengths 9 23.6k ⌀ | completion stringlengths 1 27.2k | enhanced_prompt stringlengths 167 19.7k | enhanced_completion stringlengths 488 169k | reasoning_trace stringlengths 710 161k ⌀ | branch stringclasses 1
value | context stringclasses 22
values | original_context stringclasses 22
values | subfield stringclasses 9
values |
|---|---|---|---|---|---|---|---|---|
How will boosting CO2 to 1000 parts per million impact the photosynthetic response of our high-value crops, given they're currently at 400 parts per million, under a daily light integral of 20.6 moles per square meter and a vapor pressure deficit of 0.71 kilopascals? | Assuming C3 physiology (e.g., tomato, cucumber, lettuce, cannabis), boosting CO₂ from 400 ppm to 1000 ppm under a 20.6 mol m⁻² d⁻¹ DLI and 0.71 kPa VPD will increase net photosynthetic assimilation (A) by 30–50%, but realized yield gains will constrain to 15–25% due to sink limitations, with critical risks to nutrient ... | # Task: Analyze CO2 Enrichment Impact on Crop Photosynthesis
Please analyze how elevating atmospheric carbon dioxide (CO2) from current ambient levels to 1000 parts per million (ppm) will impact the photosynthetic response of high-value crops. Your analysis must account for the specific environmental constraints provi... | ### 1. Expected Change in Photosynthetic Rate
Elevating atmospheric CO₂ from a baseline of 400 ppm to 1000 ppm will induce a substantial increase in net carbon assimilation for high-value C3 crops (e.g., tomatoes, cucumbers, lettuce). Biochemically, the elevated partial pressure of CO₂ increases substrate availability... | Alright, let's break down this CO2 enrichment problem. We're moving from a baseline of 400 ppm to 1000 ppm, a significant jump, and I need to evaluate the photosynthetic response specifically for high-value crops under a DLI of 20.6 mol/m² and a VPD of 0.71 kPa.
First, the CO2 shift from 400 to 1000 ppm. For high-valu... | trunk | {"co2_ppm": 400, "daily_light_integral_mol_m2": 20.6, "vpd_kpa": 0.71} | {"co2_ppm": 400, "daily_light_integral_mol_m2": 20.6, "vpd_kpa": 0.71} | horticulture |
In a cereal production system with a rainfall of 1500mm, if we're considering a rotation break-crop to improve soil health, and our target plant population is around 69,000 plants per hectare over a 90-day season, how do we balance the trade-off between plant population and density to maximize the benefits of the break... | ### Terminology and the Core Trade-off
Plant population and plant density are synonymous metrics (plants per unit area). Your target of 69,000 plants/ha equals **6.9 plants/m²**. The trade-off you are managing is between **population density and individual plant resource allocation**—specifically, the balance between r... | # Role
You are an expert agronomist specializing in cereal production systems and soil health management.
# Context & Data
Analyze the following specific parameters for a cereal production scenario:
```json
{"rainfall_mm": 1500, "plant_population_per_ha": 69000, "season_length_days": 90}
```
# Task
Provide a strategi... | ### Strategic Analysis: Population and Density Optimization for Break-Crop Systems
The provided parameters—1500mm of rainfall and a compressed 90-day season—create a high-resource but time-constrained environment. Balancing plant population against spatial density is critical to ensuring the break-crop fulfills its ro... | Alright, let's break down this problem. I've got 1500mm of rainfall, a 90-day season, and a target of 69,000 plants per hectare. The core task is balancing plant population against spatial density to maximize the benefits of a rotation break-crop.
First, I need to get my head around the definitions, specifically tail... | trunk | {"rainfall_mm": 1500, "plant_population_per_ha": 69000, "season_length_days": 90} | {"rainfall_mm": 1500, "plant_population_per_ha": 69000, "season_length_days": 90} | agronomy |
I've got a flock of 3,500 birds with an average target liveweight of 1.8 kg, but I'm concerned about the mortality rate of 9.4% and how it affects my overall production. Given a feed conversion ratio of 1.66, how should I adjust my stocking rate to balance pasture growth with the needs of my flock? | You cannot calculate a precise stocking rate (birds/ha) from flock performance data alone. FCR, mortality, and liveweight define feed demand and nutrient load, not land carrying capacity. Stocking rate requires matching Dry Matter (DM) supply against DM demand; your figures describe biological efficiency and loss, not ... | # Poultry Flock Management Analysis
## Context
You are an expert agricultural consultant specializing in poultry production optimization. Analyze the following flock data to provide actionable recommendations on stocking rates.
## Input Data
Please process the following dataset exactly as provided:
{"feed_conversion_... | ### Poultry Flock Management Analysis
#### 1. Production Impact Calculation
Based on the provided dataset, the production metrics for the current cycle are as follows:
* **Initial Flock Size:** 3,500 birds
* **Mortality Loss:** 3,500 birds × 9.4% = 329 birds
* **Effective Harvestable Flock:** 3,500 - 329 = **3... | Alright, let me break down this poultry flock management problem. I need to analyze the provided data and give actionable recommendations on stocking rates. I'll approach this systematically.
**Step 1: Parse the Input Data**
- Feed Conversion Ratio (FCR): 1.66
- Target Liveweight: 1.8 kg
- Mortality Rate: 9.4%
- Flock... | trunk | {"feed_conversion_ratio": 1.66, "target_liveweight_kg": 1.8, "mortality_pct": 9.4, "flock_size": 3500} | {"feed_conversion_ratio": 1.66, "target_liveweight_kg": 1.8, "mortality_pct": 9.4, "flock_size": 3500} | animal |
We have a pond with fish stocked at 270 individuals per cubic meter, and the current dissolved oxygen level is 6.1 milligrams per liter. The feed conversion ratio for these fish is 1.88. How will the dissolved oxygen budget be affected, and what management decisions should we make to maintain a healthy environment for ... | The current dissolved oxygen (DO) of 6.1 mg/L is above the acute stress threshold for most freshwater species (<5.0 mg/L for growth; <3.0 mg/L for survival), but a snapshot does not constitute a budget. The stocking density of 270 individuals/m³ indicates an intensive system where the oxygen budget is governed by the b... | # Aquaculture Management Analysis
You are an expert aquaculturist. Analyze the provided pond data to determine the impact on the dissolved oxygen (DO) budget and recommend specific management decisions to maintain a healthy environment for the fish.
## Input Data
Use the following parameters exactly as provided:
```j... | ### 1. DO Budget Impact Analysis
The current dissolved oxygen (DO) level of 6.1 mg/L is within the acceptable range for most freshwater species, but it provides a dangerously narrow safety margin given the system's intensive metabolic loads. A daytime reading of 6.1 mg/L likely reflects active photosynthesis; without ... | I need to analyze these pond parameters: stocking density of 270 fish/m³, DO at 6.1 mg/L, and FCR of 1.88. Let me work through what this means for the oxygen budget and what management actions are required.
First, the DO level of 6.1 mg/L. That's within acceptable range for most freshwater species—typically we want ab... | trunk | {"stocking_density_per_m3": 270, "dissolved_oxygen_mg_l": 6.1, "feed_conversion_ratio": 1.88} | {"stocking_density_per_m3": 270, "dissolved_oxygen_mg_l": 6.1, "feed_conversion_ratio": 1.88} | aquaculture |
I have a pond with fish stocked at 290 per cubic meter, and the dissolved oxygen level is currently at 2.7 milligrams per liter. Given a feed conversion ratio of 1.92, how will the dissolved oxygen budget be affected, and what's the practical decision I should make regarding feeding and stocking? | **Immediate Status: Critical Hypoxia**
A dissolved oxygen (DO) concentration of 2.7 mg/L is below the 3.0 mg/L critical threshold for warmwater species and is lethal for coldwater species. At this level, fish are in physiological stress, feed intake naturally suppresses, and immune function is compromised. If this meas... | # Aquaculture Management Analysis
## Context
You are an expert aquaculture consultant. Analyze the following pond conditions to determine the impact on the dissolved oxygen budget and provide actionable recommendations for feeding and stocking.
## Input Data
The following parameters define the current state of the po... | # Oxygen Budget Analysis
The current pond is in a state of severe oxygen deficit, with the biological oxygen demand (BOD) vastly exceeding the system's re-aeration capacity. A stocking density of 290 fish/m³ generates a massive cumulative respiratory load. This is critically compounded by the Feed Conversion Ratio (FC... | Alright, let's break down these pond parameters. A stocking density of 290 fish per cubic meter, dissolved oxygen at 2.7 mg/L, and an FCR of 1.92. This is a crisis scenario. I've seen ponds crash overnight with numbers like these, so I need to be precise and urgent.
First, the DO level. 2.7 mg/L is critically hypoxic.... | trunk | {"stocking_density_per_m3": 290, "dissolved_oxygen_mg_l": 2.7, "feed_conversion_ratio": 1.92} | {"stocking_density_per_m3": 290, "dissolved_oxygen_mg_l": 2.7, "feed_conversion_ratio": 1.92} | aquaculture |
We're planning to grow a crop under limited rainfall of 1500mm and we've decided on a plant population of 41000 plants per hectare. The season is expected to last 185 days. How will we need to manage our nutrient budget to optimize our crop's growth, given these conditions? | You have not specified the crop. A population of 41,000 plants/ha is standard for commercial maize (*Zea mays*); it is low for soybeans or wheat. I will proceed assuming maize; if this is another crop, the removal coefficients below are invalid. You also have not provided soil texture, baseline soil fertility (soil tes... | # Crop Nutrient Budget Optimization Plan
## Objective
Develop a comprehensive nutrient management strategy to optimize crop growth under the specific constraints provided below.
## Input Parameters
The following data defines the growing conditions. Use these exact values for your analysis:
```json
{"rainfall_mm": 150... | # Crop Nutrient Budget Optimization Plan
## 1. Water-Nutrient Interaction Analysis
With 1500mm of rainfall over a 185-day season (averaging ~8.1 mm/day), the primary agronomic challenge is nutrient loss rather than moisture deficit. Even within a limited rainfall context, this volume creates a substantial drainage pot... | Alright, let's break down this nutrient budget optimization problem. I need to analyze the given parameters—1500mm rainfall, 41,000 plants/ha, and a 185-day season—and build a comprehensive, scientifically grounded nutrient management strategy.
First, looking at the rainfall: 1500mm over 185 days. The prompt frames th... | trunk | {"rainfall_mm": 1500, "plant_population_per_ha": 41000, "season_length_days": 185} | {"rainfall_mm": 1500, "plant_population_per_ha": 41000, "season_length_days": 185} | agronomy |
I'm dealing with a sodic soil that has a pH of 6.2, organic matter content of 4.8%, and clay content of 52%. The soil's cation exchange capacity is 16.6 cmol/kg. Should I use gypsum or lime to address the sodicity, considering the soil's pH buffering capacity? | Use gypsum. Lime is chemically ineffective for sodicity remediation at pH 6.2 and risks worsening dispersion without supplying soluble calcium.
### Chemical Mechanism and pH Constraint
Sodicity remediation requires displacing exchangeable Na⁺ with Ca²⁺, then leaching the Na⁺. The amendment must supply soluble Ca²�.
*... | # Soil Amendment Analysis for Sodic Conditions
You are an expert soil scientist. Analyze the provided soil data to determine the appropriate amendment for addressing sodicity.
## Soil Data
The following parameters define the soil profile in question:
{"soil_ph": 6.2, "organic_matter_pct": 4.8, "clay_pct": 52, "cec_cm... | 1. **Recommendation**
**Gypsum** (calcium sulfate) is the correct amendment choice for this scenario.
2. **Reasoning**
* **The relationship between the current pH (6.2) and the effectiveness of lime vs. gypsum:**
The current soil pH is 6.2, which is slightly acidic to near-neutral. While lime (calcium carbonate... | Looking at this soil data, I need to evaluate whether gypsum or lime is the appropriate amendment for addressing sodicity in this particular soil profile.
Let me work through the parameters systematically:
**pH Analysis (6.2):**
The soil pH is 6.2 — slightly acidic to near-neutral. This is a crucial determinant. Lime... | trunk | {"soil_ph": 6.2, "organic_matter_pct": 4.8, "clay_pct": 52, "cec_cmol_kg": 16.6} | {"soil_ph": 6.2, "organic_matter_pct": 4.8, "clay_pct": 52, "cec_cmol_kg": 16.6} | soil |
We've got a situation where 23% of our crop is currently infected, and for every percentage point of infection, we're losing about 0.61% of our yield. The recent weather has given us 10 hours of leaf wetness, which is a key factor in disease spread. Should we apply fungicide now, based on the epidemic threshold, and wh... | Current estimated yield loss is 14.03%, calculated as 23% incidence × 0.61% yield loss per incidence point. This represents sunk cost; the fungicide decision depends on preventing marginal future loss.
**Epidemic Mechanism and Environmental Driver**
The 10 hours of leaf wetness is the critical mechanistic trigger. For... | # Agricultural Disease Management Analysis
## Context
We are facing a situation where 23% of our crop is currently infected. For every percentage point of infection, we are losing approximately 0.61% of our yield. Recent weather conditions have resulted in 10 hours of leaf wetness, a critical factor in disease spread.... | ### 1. Decision Recommendation
**Yes, apply fungicide immediately**, provided the crop is still in a yield-forming growth stage.
With 23% of the crop already infected, the projected yield loss is approximately **14.03%** (23% incidence × 0.61% yield loss per point). This represents a sunk cost; the fungicide decisio... | Let me break down the parameters we're working with. We have 23% disease incidence, a yield loss coefficient of 0.61% per incidence point, and 10 hours of leaf wetness. I need to evaluate this against the concept of the epidemic threshold and determine if an immediate fungicide application is warranted.
First, let's q... | trunk | {"incidence_pct": 23, "yield_loss_per_incidence_pct": 0.61, "leaf_wetness_hours": 10} | {"incidence_pct": 23, "yield_loss_per_incidence_pct": 0.61, "leaf_wetness_hours": 10} | pathology |
We've got a situation with a disease outbreak in our crop, where 26 percent of the plants are affected, and for every percent of incidence, we're seeing a yield loss of 0.41. The weather forecast says we've had 15 hours of leaf wetness. How should we think about rotating modes of action to manage resistance, given the ... | Modelled yield loss is 10.66% (26% incidence × 0.41 loss coefficient). This assumes linearity; in many pathosystems, loss accelerates non-linearly once incidence exceeds 20% due to secondary spread. If this infection is at flowering, 10.66% is conservative; if late grain fill, the economic impact is negligible despite ... | # Crop Disease Management and Resistance Rotation Strategy
## Situation Overview
Analyze the current crop disease outbreak and provide a strategic recommendation for rotating modes of action to manage fungicide resistance. Your analysis must integrate the provided data with the **Disease Triangle** framework (which ex... | # Crop Disease Management and Resistance Rotation Strategy
## 1. Impact Assessment
Based on the provided metrics, the projected yield loss is calculated as follows:
* **Calculation:** 26% (incidence) × 0.41 (yield loss per percent) = **10.66% estimated yield loss**.
A projected loss exceeding 10% is economically cr... | Alright, let's break down this problem. I need to analyze a crop disease outbreak using specific data and the Disease Triangle framework, then come up with a resistance rotation strategy.
**Step 1: Impact Assessment**
First, the numbers. Incidence is 26%, and yield loss per incidence percent is 0.41.
Calculation: 26 *... | trunk | {"incidence_pct": 26, "yield_loss_per_incidence_pct": 0.41, "leaf_wetness_hours": 15} | {"incidence_pct": 26, "yield_loss_per_incidence_pct": 0.41, "leaf_wetness_hours": 15} | pathology |
I'm managing a catfish pond with a stocking density of 180 fish per cubic meter and dissolved oxygen levels at 5.0 milligrams per liter. The current feed conversion ratio is 2.08. How does this feed conversion ratio impact my pond management, considering the overall health and growth of the fish, and what decisions wou... | An FCR of 2.08 at 180 fish/m³ indicates significant metabolic inefficiency, driving waste loading and oxygen demand beyond what a 5.0 mg/L dissolved oxygen (DO) reserve can safely buffer. In intensive catfish systems, target FCR typically ranges from 1.2 to 1.6. Your current ratio means 52% of feed mass input is not co... | # Role
Act as an expert aquaculture consultant specializing in catfish pond management.
# Context Data
Analyze the following specific pond parameters provided by the user:
```json
{"stocking_density_per_m3": 180, "dissolved_oxygen_mg_l": 5.0, "feed_conversion_ratio": 2.08}
```
# Definitions
- **Stocking Density**: Th... | # Catfish Pond Management Analysis and Recommendations
Based on the provided parameters—a stocking density of 180 fish/m³, a dissolved oxygen (DO) level of 5.0 mg/L, and a feed conversion ratio (FCR) of 2.08—the pond is operating under high-intensity conditions with significant inefficiencies. The interplay between th... | Alright, let me break down this pond data. I've got a stocking density of 180 fish/m³, dissolved oxygen at 5.0 mg/L, and an FCR of 2.08. Time to put on my consultant hat and dig into what this means for a catfish operation.
First, the stocking density. 180 fish/m³ is high-intensity. That's pushing the limits of a trad... | trunk | {"stocking_density_per_m3": 180, "dissolved_oxygen_mg_l": 5.0, "feed_conversion_ratio": 2.08} | {"stocking_density_per_m3": 180, "dissolved_oxygen_mg_l": 5.0, "feed_conversion_ratio": 2.08} | aquaculture |
We're planning to plant a crop in an area with rainfall of 700mm and a season length of 100 days. If we're aiming for a plant population of 49,000 plants per hectare, how would you assess the potential impact of this density on the crop's water usage, and would you consider adjusting the population to optimize water av... | The critical missing variable is crop species. A population of 49,000 plants/ha is standard for maize, low for soybeans, and high for sunflower. I will proceed assuming **maize (Zea mays)**, as this density is characteristic and represents a high-risk scenario for water sensitivity. If planting sorghum, maintain or inc... | # Crop Population and Water Usage Assessment
## Context
We are planning to plant a crop in an area with the following specific conditions:
- **Rainfall**: 700mm
- **Season Length**: 100 days
- **Target Plant Population**: 49,000 plants per hectare
## Input Data
Please use the following data parameters for your analys... | ### 1. Impact Analysis
To evaluate the impact of the target density on water usage, we must first quantify the water budget. A rainfall of 700mm provides 7,000,000 liters per hectare (1mm = 10,000 L/ha). However, not all rainfall is plant-available; assuming roughly 70% effectiveness (accounting for runoff, deep drain... | Alright, let's break down this crop population and water usage problem. I need to look at 700mm of rainfall, a 100-day season, and a target of 49,000 plants per hectare.
First, I'll quantify the total water budget. 700mm of rain over one hectare... 1mm over a hectare is 10,000 liters, so 700mm gives us 7,000,000 liter... | trunk | {"rainfall_mm": 700, "plant_population_per_ha": 49000, "season_length_days": 100} | {"rainfall_mm": 700, "plant_population_per_ha": 49000, "season_length_days": 100} | agronomy |
I'm concerned about the risk of aflatoxin contamination in our grain storage. If the current residue level is at the maximum allowable limit of 1.72 milligrams per kilogram and it has a half-life of 20.4 days, how will the residue level decrease over time and what's the risk of exceeding this threshold if we apply a tr... | Immediate compliance status is **failed**. Applying a treatment at 0.59 mg/kg to grain already at the Maximum Residue Limit (MRL) of 1.72 mg/kg yields an initial post-application concentration ($C_0$) of 2.31 mg/kg, exceeding the threshold by 34.3%.
### Decay Kinetics and Compliance Window
Assuming first-order decay k... | # Aflatoxin Contamination Risk Assessment
## Context
I am concerned about the risk of aflatoxin (a toxic fungal byproduct) contamination in our grain storage. We must ensure strict compliance with food safety standards regarding residue levels.
## Input Data
Please use the following parameters for your analysis:
```j... | ### Critical Scientific Note
Before proceeding with the quantitative analysis, it is essential to address a fundamental discrepancy in the provided parameters. The data supplied (a 20.4-day half-life, an application rate, and an MRL of 1.72 mg/kg) aligns with **pesticide residue kinetics**, not **aflatoxin contaminatio... | The user is asking for an aflatoxin contamination risk assessment based on specific input parameters. Let me look at these parameters closely: half-life of 20.4 days, MRL of 1.72 mg/kg, and application rate of 0.59 mg/kg.
Wait a minute. Aflatoxins are mycotoxins produced by *Aspergillus* fungi. They don't have a "hal... | trunk | {"residue_half_life_days": 20.4, "mrl_mg_kg": 1.72, "application_rate_mg_kg": 0.59} | {"residue_half_life_days": 20.4, "mrl_mg_kg": 1.72, "application_rate_mg_kg": 0.59} | food_safety |

This dataset is a remastered version prepared using Adaption's Adaptive Data platform.
adaption-agronomic_decision_reasoning
This dataset contains expert-level prompts and completions focused on solving complex agricultural management problems in aquaculture, soil science, and crop production. Each sample provides a detailed scenario with specific quantitative parameters, followed by a mechanistic analysis that identifies constraints, calculates risks, and recommends actionable decisions. The content emphasizes the interplay between biological processes, economic thresholds, and operational limitations to guide optimal farming practices.
Dataset size
There are 22,754 data points in this dataset. This is an instruction tuning dataset.
Quality of Remastered Dataset
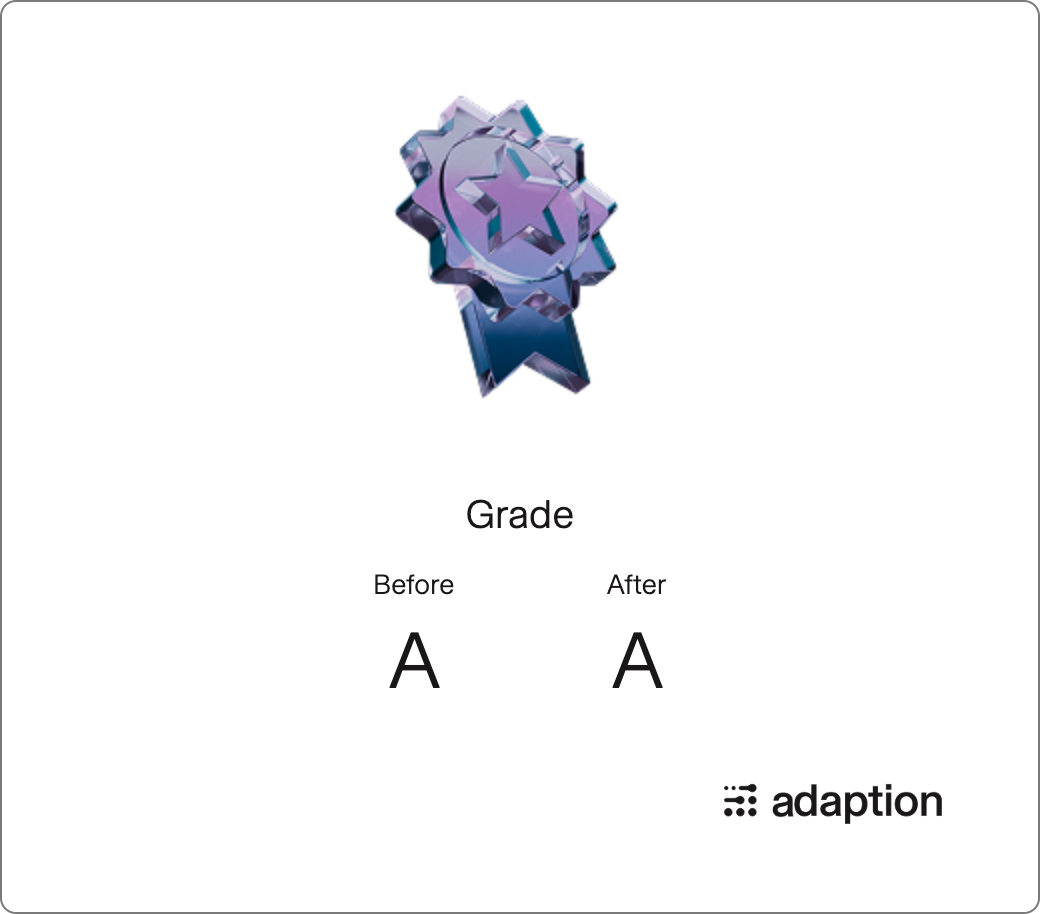
The final quality is A, with a relative quality improvement of 5.6%.
Domain
- Agriculture (100%)
Language
- English (100%)
Tone
- Analytical (54%)
- Practical (24%)
- Technical (20%)
Evaluation Results
Quality Gains:
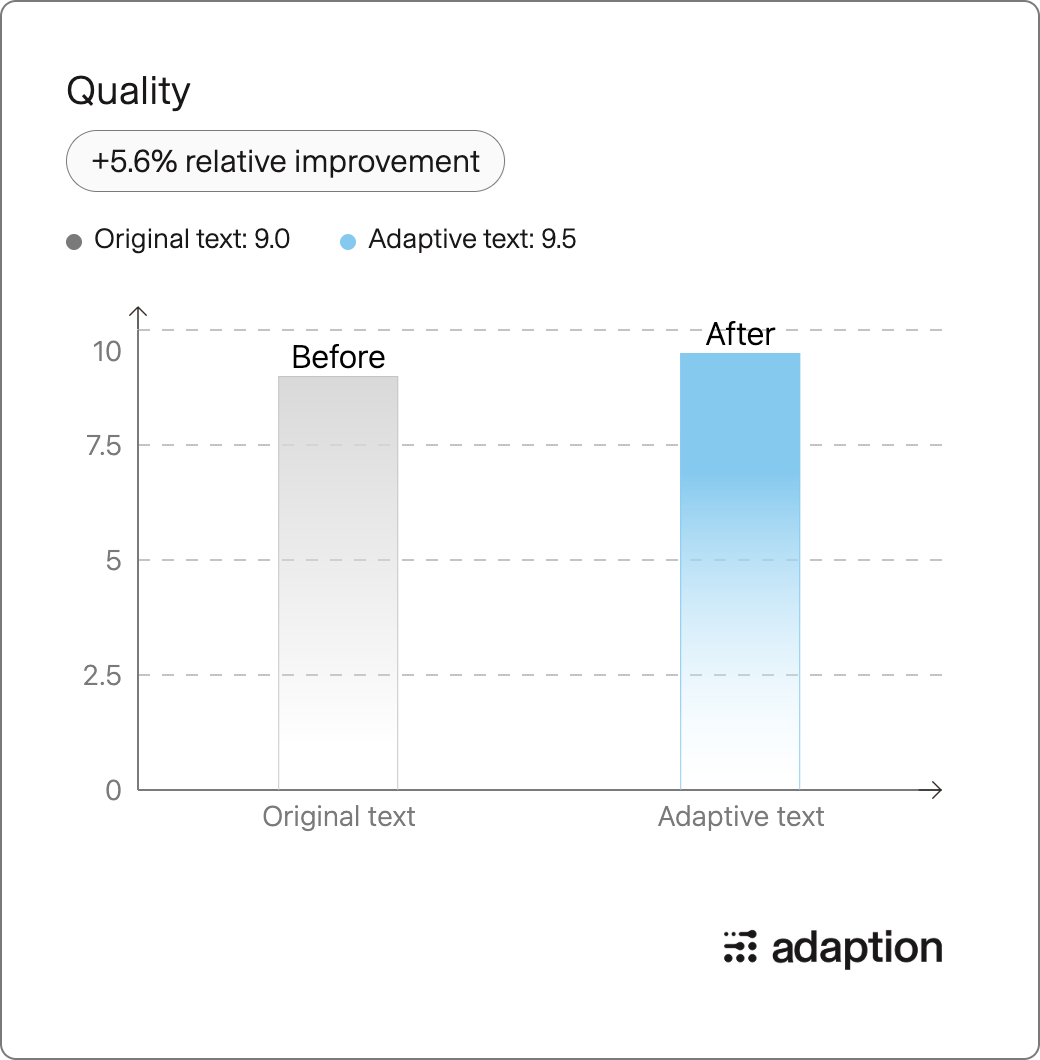
Grade Improvement:
Percentile Chart:
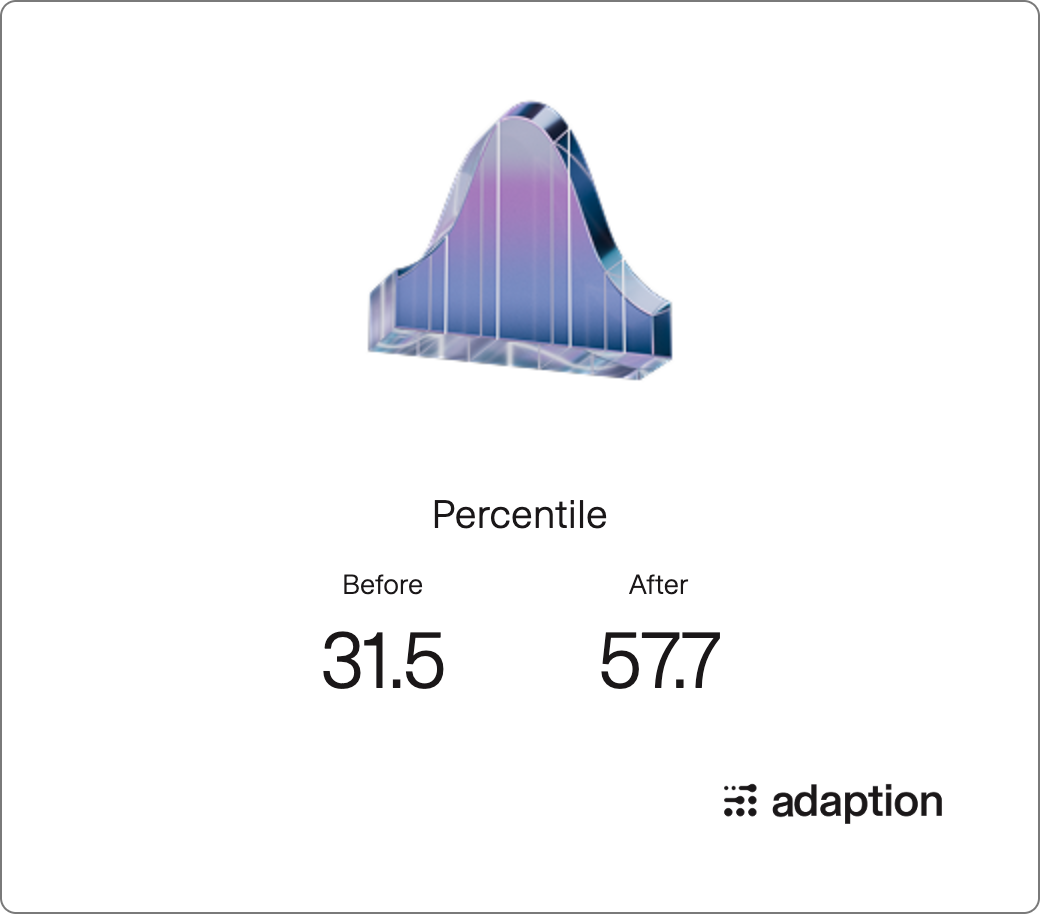
- Downloads last month
- 34