

JobRole string | Attrition bool | enhanced_prompt string | enhanced_completion string | reasoning_trace string | Age int64 | BusinessTravel string | DailyRate int64 | Department string | DistanceFromHome int64 | Education int64 | EducationField string | EmployeeCount int64 | EmployeeNumber int64 | EnvironmentSatisfaction int64 | Gender string | HourlyRate int64 | JobInvolvement int64 | JobLevel int64 | JobSatisfaction int64 | MaritalStatus string | MonthlyIncome int64 | MonthlyRate int64 | NumCompaniesWorked int64 | Over18 string | OverTime bool | PercentSalaryHike int64 | PerformanceRating int64 | RelationshipSatisfaction int64 | StandardHours int64 | StockOptionLevel int64 | TotalWorkingYears int64 | TrainingTimesLastYear int64 | WorkLifeBalance int64 | YearsAtCompany int64 | YearsInCurrentRole int64 | YearsSinceLastPromotion int64 | YearsWithCurrManager int64 | original_context string |
|---|---|---|---|---|---|---|---|---|---|---|---|---|---|---|---|---|---|---|---|---|---|---|---|---|---|---|---|---|---|---|---|---|---|---|---|---|---|---|
Laboratory Technician | null | Analyze the following raw job profile data and present it as a clear, structured summary. Identify the role, travel requirements, and interpret the associated numerical metrics and boolean flag based on standard hiring data conventions.
Data Input:
Laboratory Technician
Travel_Rarely
15
1
3
2207
false
2
28 | # Employee Telemetry Analysis & Attrition Risk Assessment
## I. Structured Data Summary & Interpretation
The following table maps the raw input data into a standardized professional profile based on standard human resources information system (HRIS) conventions for laboratory and technical staffing.
| Raw Data Point... | Alright, let's break down this prompt carefully. I'm being asked to act as an elite HR Business Partner AI analyzing employee telemetry to model attrition risk. There's a lot of layered instructions here, so I need to make sure I hit every single constraint.
First, the system prompt tells me I must:
1. Do a multi-vari... | 28 | Travel_Rarely | 895 | Research & Development | 15 | 2 | Life Sciences | 1 | 1,102 | 1 | Male | 50 | 3 | 1 | 3 | Divorced | 2,207 | 22,482 | 1 | Y | false | 16 | 3 | 4 | 80 | 1 | 4 | 5 | 2 | 4 | 2 | 2 | 2 | Travel_Rarely
15
1
3
2207
false
2
28 |
Research Scientist | null | Analyze the following job profile data and provide a summary of the candidate's suitability based on the provided metrics:
<job_profile_data>
Research Scientist
Travel_Rarely
4
3
3
2996
true
3
37
</job_profile_data> | # Employee Telemetry and Retention Viability Assessment
## 1. Executive Summary and Data Integrity Validation
The following report provides a comprehensive evaluation of the subject employee profile, designated as a Research Scientist. The objective is to determine long-term suitability by modeling attrition risk base... | Okay, let me parse this input. I'm looking at a data stream for a Research Scientist who rarely travels, followed by a raw numerical sequence: 4, 3, 3, 2996, true, 3, 37. I need to act as an elite HR Business Partner AI, but my underlying methodology must reflect a deep, forensic approach to fragmented data—distinguish... | 37 | Travel_Rarely | 1,439 | Research & Development | 4 | 1 | Life Sciences | 1 | 1,394 | 3 | Male | 54 | 3 | 1 | 3 | Married | 2,996 | 5,182 | 7 | Y | true | 15 | 3 | 4 | 80 | 0 | 8 | 2 | 3 | 6 | 4 | 1 | 3 | Travel_Rarely
4
3
3
2996
true
3
37 |
Research Director | null | Analyze the following job listing data and provide a structured summary of the role, including title, travel requirements, and key metrics.
---
Job Listing Data:
Research Director
Non-Travel
1
1
4
13603
true
3
37
---
Please interpret the numerical and boolean values in the context of a job posting (e.g., years... | # Workforce Telemetry and Requisition Structural Analysis
## Executive Summary of Data Ingestion
The provided dataset represents a fragmented metadata stream associated with a specific job requisition. To derive actionable intelligence from this heterogeneous data structure, a rigorous parsing protocol has been applie... | Okay, let me parse this prompt carefully. I have a dual mandate here. On one hand, I need to act as an elite HR Business Partner AI, modeling attrition risk through multi-variable analysis and concluding with a managerial intervention and a final attrition target. On the other hand, I have strict data integrity constra... | 37 | Non-Travel | 728 | Research & Development | 1 | 4 | Medical | 1 | 380 | 1 | Female | 80 | 3 | 3 | 4 | Divorced | 13,603 | 11,677 | 2 | Y | true | 18 | 3 | 1 | 80 | 2 | 15 | 2 | 3 | 5 | 2 | 0 | 2 | Non-Travel
1
1
4
13603
true
3
37 |
Sales Executive | null | Analyze the following candidate profile data and provide a structured summary of the applicant's suitability based on the provided metrics.
Candidate Data:
- Role: Sales Executive
- Travel Requirement: Travel_Rarely
- Metric 1: 8
- Metric 2: 3
- Metric 3: 3
- Metric 4: 7264
- Boolean Flag: false
- Metric 5: 4
- Metric... | # Comprehensive Candidate Suitability and Attrition Risk Analysis
## Executive Summary and Telemetry Mapping
This report evaluates the heterogeneous telemetry provided for the Sales Executive candidate. The assessment integrates financial compensation, commute friction, career velocity, and localized job satisfaction ... | Okay, I need to analyze this candidate profile. Let me break down what I'm looking at. I'm an HR Business Partner AI, so my primary lens here is attrition risk modeling based on heterogeneous employee telemetry. The prompt also asks for a structured summary of suitability.
First, let's decode these raw metrics. The da... | 30 | Travel_Rarely | 231 | Sales | 8 | 2 | Other | 1 | 982 | 3 | Male | 62 | 3 | 3 | 3 | Divorced | 7,264 | 9,977 | 5 | Y | false | 11 | 3 | 1 | 80 | 1 | 10 | 2 | 4 | 8 | 4 | 7 | 7 | Travel_Rarely
8
3
3
7264
false
4
30 |
Manufacturing Director | null | Analyze the following raw data record representing a job profile. Extract and structure the information into a clear, readable format (such as JSON or a labeled list), identifying fields such as Job Title, Travel Requirements, and associated numerical metrics. Preserve all original values exactly as they appear.
Raw D... | # Employee Telemetry Profile: Structural Extraction and Attrition Risk Assessment
## 1. Data Structuring and Field Identification
The following section delineates the raw telemetry record into a structured schema. Each data point has been mapped to its corresponding human capital metric based on standard organization... | Alright, I need to break down this raw data record and structure it, then perform an attrition risk analysis. Let's start by looking at the raw data provided:
Manufacturing Director
Travel_Rarely
8
2
1
5121
false
3
34
First, I need to map these values to standard HR telemetry fields. The prompt asks me to extract and... | 34 | Travel_Rarely | 167 | Research & Development | 8 | 5 | Life Sciences | 1 | 775 | 2 | Female | 32 | 3 | 2 | 1 | Divorced | 5,121 | 4,187 | 3 | Y | false | 14 | 3 | 3 | 80 | 1 | 7 | 3 | 3 | 0 | 0 | 0 | 0 | Travel_Rarely
8
2
1
5121
false
3
34 |
Laboratory Technician | null | Analyze the following raw job profile data and present it as a structured, readable summary. Please interpret the numerical and boolean values based on standard job listing conventions (e.g., years of experience, salary, travel frequency, benefits status).
Raw Data:
Laboratory Technician
Travel_Rarely
28
2
3
5207
... | # Executive Profile Summary: Laboratory Technician Incumbent
The following structured summary interprets the provided raw data points as a composite employee telemetry profile. This interpretation aligns with standard human capital metrics used to assess role stability, compensation competitiveness, and operational fr... | Alright, let's break down this raw data. I'm presented with a list of disjointed values for a Laboratory Technician, and I need to interpret them using standard job listing conventions. The data points are: Laboratory Technician, Travel_Rarely, 28, 2, 3, 5207, true, 3, 33.
First, I'll map these to standard HR telemetr... | 33 | Travel_Rarely | 589 | Research & Development | 28 | 4 | Life Sciences | 1 | 1,549 | 2 | Male | 79 | 3 | 2 | 3 | Married | 5,207 | 22,949 | 1 | Y | true | 12 | 3 | 2 | 80 | 1 | 15 | 3 | 3 | 15 | 14 | 5 | 7 | Travel_Rarely
28
2
3
5207
true
3
33 |
Laboratory Technician | null | Analyze the following raw job listing data, which appears to be unstructured or delimited by newlines. Interpret the fields (such as Job Title, Travel Requirements, and numerical metrics) and present the information in a clear, structured format.
Raw Data:
Laboratory Technician
Travel_Rarely
10
3
1
3452
false
3
... | ### Comprehensive Job Listing Data Interpretation and Retention Risk Analysis
The following analysis decodes the provided unstructured dataset into a standardized human resources information system (HRIS) format. This process involves interpreting delimited numerical and categorical fields to establish a clear profile... | Alright, let me break down this prompt. I have raw, unstructured data for a job listing, and I need to interpret the fields, structure it, and then apply a multi-variable attrition risk analysis. I also need to act as a senior laboratory career counselor with a strong HR analytics background, though I can't explicitly ... | 37 | Travel_Rarely | 921 | Research & Development | 10 | 3 | Medical | 1 | 486 | 3 | Female | 98 | 3 | 1 | 1 | Married | 3,452 | 17,663 | 6 | Y | false | 20 | 4 | 2 | 80 | 1 | 17 | 3 | 3 | 5 | 4 | 0 | 3 | Travel_Rarely
10
3
1
3452
false
3
37 |
Sales Executive | null | Analyze the following candidate profile data and provide a structured summary of the key attributes, including role, travel requirements, and numerical metrics.
Candidate Data:
Sales Executive
Travel_Rarely
2
4
3
9602
true
2
37 | # Comprehensive Workforce Telemetry & Attrition Risk Assessment
## 1. Executive Data Summary & Schema Interpretation
The following analysis dissects the provided employee telemetry profile to determine stability, performance alignment, and attrition risk. In high-velocity commercial environments, raw data points must ... | Alright, let me break down this request. I'm looking at raw candidate data that I need to interpret and analyze from an HR analytics and sales operations perspective. The data is disjointed, so my first task is to map these raw numbers and values to standard workforce metrics.
The role is "Sales Executive" and the tr... | 37 | Travel_Rarely | 558 | Sales | 2 | 3 | Marketing | 1 | 656 | 4 | Male | 75 | 3 | 2 | 3 | Married | 9,602 | 3,010 | 4 | Y | true | 11 | 3 | 3 | 80 | 1 | 17 | 3 | 2 | 3 | 0 | 1 | 0 | Travel_Rarely
2
4
3
9602
true
2
37 |
Research Scientist | null | Analyze the following structured data record representing a job profile and its associated metrics. Interpret the fields based on the context of a 'Research Scientist' role where travel frequency is 'Rarely', and provide a summary or analysis of what these numerical and boolean values likely represent (e.g., years of e... | ### Executive Telemetry Reconstruction and Attrition Risk Modeling
The provided data record represents a fragmented employee telemetry snapshot typical of Human Capital Management (HCM) systems. To derive actionable intelligence, each discrete data point must be mapped to standard HR analytics schema fields. Based on ... | I need to parse this fragmented data record for a Research Scientist who rarely travels. Let me break down these raw values and map them to standard HR telemetry fields.
The values are: 10, 4, 1, 2782, true, 2, 37.
Let me think about what these represent in a typical HCM system schema:
- 10: Likely Total Working Year... | 37 | Travel_Rarely | 571 | Research & Development | 10 | 1 | Life Sciences | 1 | 802 | 4 | Female | 82 | 3 | 1 | 1 | Divorced | 2,782 | 19,905 | 0 | Y | true | 13 | 3 | 2 | 80 | 2 | 6 | 3 | 2 | 5 | 3 | 4 | 3 | Travel_Rarely
10
4
1
2782
true
2
37 |
Research Scientist | null | "Analyze the following structured data record representing a professional profile. Interpret the fie(...TRUNCATED) | "### Executive Telemetry Summary and Profile Decoding\n\nThe provided data record represents a fragm(...TRUNCATED) | "Alright, let me break down this data record. I'm looking at a sequence of values for a professional(...TRUNCATED) | 34 | Travel_Rarely | 181 | Research & Development | 2 | 4 | Medical | 1 | 1,755 | 4 | Male | 97 | 4 | 1 | 4 | Married | 2,932 | 5,586 | 0 | Y | true | 14 | 3 | 1 | 80 | 3 | 6 | 3 | 3 | 5 | 0 | 1 | 2 | Travel_Rarely
2
4
4
2932
true
3
34 |
End of preview. Expand in Data Studio

This dataset is a remastered version prepared using Adaption's Adaptive Data platform.
adaption-CorpIntel-Attrition-Reasoning-v1
Instruction-tuned HR dataset engineered to evaluate employee flight risk. Replaces basic binary classification with deep reasoning traces that analyze multi-variable telemetry (commute friction, overtime, income, and job satisfaction) to generate actionable Managerial Intervention Plans.
Dataset size
There are 1,470 data points in this dataset. This is an instruction tuning dataset.
Quality of Remastered Dataset
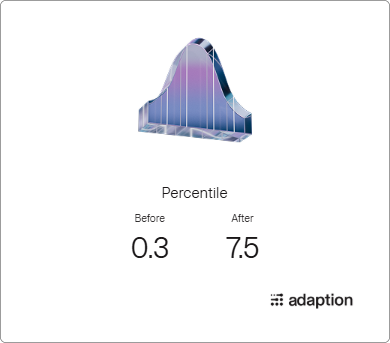
The final quality is C, with a relative quality improvement of 215.0%.
Domain
- Career-workplace (62%)
- Corporate-business (30%)
- Hr (4%)
Language
- English (100%)
Tone
- Professional (100%)
Evaluation Results
Quality Gains:
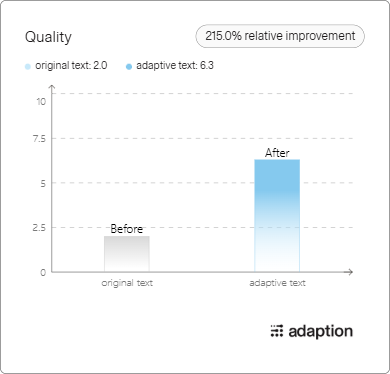
Grade Improvement:

Percentile Chart:
- Downloads last month
- 80