



HarryCheung6688/plant-disease-diagnose
Updated • 3
text stringlengths 54 140 |
|---|
raw/color/Raspberry___healthy/a37f34f7-022d-461a-8a3d-95f5cd774e35___Mary_HL 9155.JPG |
raw/color/Raspberry___healthy/368f3c83-5bd2-4906-b418-57b6ceff9bfe___Mary_HL 9160.JPG |
raw/color/Raspberry___healthy/98226f66-15a1-40d5-9b62-04ae5b4fd8d5___Mary_HL 9159.JPG |
raw/color/Raspberry___healthy/e2bc5cd9-a590-4b06-a610-dec52f74ae1e___Mary_HL 9163.JPG |
raw/color/Raspberry___healthy/de3b86c7-8f0b-4cd8-ab11-2450fff0ec52___Mary_HL 9154.JPG |
raw/color/Raspberry___healthy/dbaa5f62-187f-422b-ac84-12c6e7b12025___Mary_HL 9164.JPG |
raw/color/Raspberry___healthy/8e5806cd-b3f0-4737-8be0-9b7726d8b33c___Mary_HL 9165.JPG |
raw/color/Raspberry___healthy/432379a4-dc5d-49fa-9d75-ebe05a1e01eb___Mary_HL 9161.JPG |
raw/color/Raspberry___healthy/599c43e6-e742-4bc6-92a1-a1ebe4fa820a___Mary_HL 9158.JPG |
raw/color/Raspberry___healthy/12a43ab6-1f18-4b10-9fb4-4865b216d28e___Mary_HL 9156.JPG |
raw/color/Raspberry___healthy/fa3964a3-4eb8-49c8-b62c-b57e3d121996___Mary_HL 9162.JPG |
raw/color/Raspberry___healthy/ecd85c83-4675-4657-9c48-ca9ef7bdd1ef___Mary_HL 9157.JPG |
raw/color/Raspberry___healthy/b8a96dea-8442-4855-9fdf-c29c9d4eca5a___Mary_HL 6398.JPG |
raw/color/Raspberry___healthy/42428dcc-fefc-46dd-b209-150fbeaf4862___Mary_HL 6397.JPG |
raw/color/Raspberry___healthy/6d141ce7-7f73-4c5c-9cec-3b4ed52aad00___Mary_HL 6399.JPG |
raw/color/Raspberry___healthy/b446d3f3-e55a-45eb-8e46-d2e3cc7e40b5___Mary_HL 6403.JPG |
raw/color/Raspberry___healthy/75d0565c-0e80-4cac-9f11-dfc537d68677___Mary_HL 6401.JPG |
raw/color/Raspberry___healthy/8eef072d-0f99-4ba4-9003-249f5395d6f5___Mary_HL 6400.JPG |
raw/color/Raspberry___healthy/2e6f50f0-c9ac-4990-bb81-46936cb62a17___Mary_HL 6402.JPG |
raw/color/Raspberry___healthy/076d909d-cfca-47ce-a8d1-479bb77c4bab___Mary_HL 6294.JPG |
raw/color/Raspberry___healthy/9efc34db-3437-4ba6-b989-70febfb37305___Mary_HL 6298.JPG |
raw/color/Raspberry___healthy/e6914eed-6170-4d2f-98d6-390a1c8600f2___Mary_HL 6297.JPG |
raw/color/Raspberry___healthy/4e1efa30-c1ef-4328-91f1-892747a9bcaf___Mary_HL 6295.JPG |
raw/color/Raspberry___healthy/b5695141-b666-419c-aad9-602fa6f47737___Mary_HL 6296.JPG |
raw/color/Raspberry___healthy/1875f778-fa4f-472a-adbc-88dd033011a7___Mary_HL 6292.JPG |
raw/color/Raspberry___healthy/5b9c0974-8b91-4288-bd65-8ccaef4b9530___Mary_HL 6293.JPG |
raw/color/Raspberry___healthy/895d0a2d-5fda-47ca-af52-5cf4f07d610c___Mary_HL 6349.JPG |
raw/color/Raspberry___healthy/9e64e964-c4c6-4cf7-80e4-ef0a4ff7d386___Mary_HL 6350.JPG |
raw/color/Raspberry___healthy/4cc1078f-0752-4e3c-bfa0-ed787c1631a4___Mary_HL 6351.JPG |
raw/color/Raspberry___healthy/3d9757e9-7753-4d8c-8c60-d78f4522b021___Mary_HL 6352.JPG |
raw/color/Raspberry___healthy/a9b01b22-29b0-43de-9e0d-e93698acc780___Mary_HL 6348.JPG |
raw/color/Raspberry___healthy/a8530446-f16a-4c42-abb9-bbe2d83bb94d___Mary_HL 6353.JPG |
raw/color/Raspberry___healthy/3734da4f-b4d3-4457-b73e-1da889ff9ca1___Mary_HL 6347.JPG |
raw/color/Raspberry___healthy/ba2f9f86-c854-42d0-bc56-0992eaa2799a___Mary_HL 6302.JPG |
raw/color/Raspberry___healthy/b3231913-b0e1-4209-8fcb-77d9855eced1___Mary_HL 6306.JPG |
raw/color/Raspberry___healthy/7da82159-e6d3-4166-ab03-f2ef9eeb4d10___Mary_HL 6304.JPG |
raw/color/Raspberry___healthy/9f63daed-c468-4783-94c9-c703187a37ad___Mary_HL 6303.JPG |
raw/color/Raspberry___healthy/f6beccbc-454c-445a-ac92-e294bc712252___Mary_HL 6305.JPG |
raw/color/Raspberry___healthy/0df51eb7-e701-492b-bb9f-994d30ea16c7___Mary_HL 6301.JPG |
raw/color/Raspberry___healthy/20f4809a-295a-4671-ae22-1bf60ec9fc80___Mary_HL 6299.JPG |
raw/color/Raspberry___healthy/27542f80-1341-427b-8376-f34255e93092___Mary_HL 6300.JPG |
raw/color/Raspberry___healthy/1bc672d8-2546-4f01-9482-a97e0d6cc345___Mary_HL 9303.JPG |
raw/color/Raspberry___healthy/1f7b581b-0d3c-4b15-ba28-caedd1d0895c___Mary_HL 9300.JPG |
raw/color/Raspberry___healthy/23b44f6d-0a70-4587-85ac-534ca483a49e___Mary_HL 9296.JPG |
raw/color/Raspberry___healthy/57cdc3ce-f08d-4082-bad2-819a8f3489ca___Mary_HL 9293.JPG |
raw/color/Raspberry___healthy/6e41633c-1c44-44a6-9cc7-fd2d52a1f5c7___Mary_HL 9297.JPG |
raw/color/Raspberry___healthy/caff89cd-939b-415c-b02c-8bbe1149893c___Mary_HL 9302.JPG |
raw/color/Raspberry___healthy/28b1e241-4234-4710-893c-b75c6dec6fa7___Mary_HL 9299.JPG |
raw/color/Raspberry___healthy/6e46f8bd-3bbd-4a8d-945c-c3959c01f0fd___Mary_HL 9294.JPG |
raw/color/Raspberry___healthy/a5d1fa7f-14bf-4c47-ac20-dc995e1f7016___Mary_HL 9301.JPG |
raw/color/Raspberry___healthy/9effa4a0-acd4-420c-bb44-535b4834ab67___Mary_HL 9295.JPG |
raw/color/Raspberry___healthy/a2a60055-0788-42e6-9ab5-b234c1739ebb___Mary_HL 9298.JPG |
raw/color/Raspberry___healthy/8c7736ec-6aff-45d8-9ee3-4609496a9f5b___Mary_HL 6245.JPG |
raw/color/Raspberry___healthy/54564261-1cce-4a60-ab02-ff8b31b5e6f1___Mary_HL 6244.JPG |
raw/color/Raspberry___healthy/abe86a95-19a5-43d3-ad40-1d5d2c2f5878___Mary_HL 6242.JPG |
raw/color/Raspberry___healthy/9b4b800b-ad23-435b-843e-035226811248___Mary_HL 6243.JPG |
raw/color/Raspberry___healthy/1bf5e5e4-d00c-442c-b153-497aa3ed9278___Mary_HL 6240.JPG |
raw/color/Raspberry___healthy/74a39783-3c14-4dd3-88b4-d66dbd127787___Mary_HL 6239.JPG |
raw/color/Raspberry___healthy/a1a0440c-f12d-40de-884f-71cd96d96e67___Mary_HL 6238.JPG |
raw/color/Raspberry___healthy/2d98e51f-8702-4309-944b-e196c2ec5275___Mary_HL 6241.JPG |
raw/color/Raspberry___healthy/03a615df-ed85-4ae6-8b41-d5b4c980b76b___Mary_HL 6366.JPG |
raw/color/Raspberry___healthy/187f5dcf-6cf1-4d4f-b1be-e7dfa587ee15___Mary_HL 6367.JPG |
raw/color/Raspberry___healthy/2f5293ed-9843-4c15-830e-94ea76b56c3a___Mary_HL 6368.JPG |
raw/color/Raspberry___healthy/3704d044-7a5d-4f95-8e5e-e5b2b9f1de68___Mary_HL 6369.JPG |
raw/color/Raspberry___healthy/f9a17672-1988-4d21-be88-a47880d56e44___Mary_HL 6365.JPG |
raw/color/Raspberry___healthy/1997bed9-d59a-4c4a-b342-15a1089af75b___Mary_HL 6363.JPG |
raw/color/Raspberry___healthy/7ba1a91f-41d0-4ff2-a994-4d469ad26b0c___Mary_HL 6370.JPG |
raw/color/Raspberry___healthy/3dee0318-2add-408a-99f5-38344f25ea3d___Mary_HL 6362.JPG |
raw/color/Raspberry___healthy/4d81c781-9651-4262-bdad-545a8c7f0ce2___Mary_HL 6364.JPG |
raw/color/Raspberry___healthy/864352f7-e173-489b-929a-f9f90ef9d368___Mary_HL 9150.JPG |
raw/color/Raspberry___healthy/5a43ca3a-6454-4339-b9d9-3ad5e3ca8314___Mary_HL 9147.JPG |
raw/color/Raspberry___healthy/824685c5-3416-4870-ba42-cc49e719c3b2___Mary_HL 9151.JPG |
raw/color/Raspberry___healthy/8a4fee29-822c-42da-8eab-9ae04234ee5c___Mary_HL 9153.JPG |
raw/color/Raspberry___healthy/68c91797-4323-4a34-a203-8393cdf3889b___Mary_HL 9143.JPG |
raw/color/Raspberry___healthy/85a36b6e-2a95-42de-8caa-4f985cd60e13___Mary_HL 9152.JPG |
raw/color/Raspberry___healthy/75f56384-1805-4f7f-8ad8-a2871d344bff___Mary_HL 9144.JPG |
raw/color/Raspberry___healthy/1e2f76bb-af16-4cc5-9fed-8efa9a68d6a3___Mary_HL 9142.JPG |
raw/color/Raspberry___healthy/db5f68e1-0cdd-401b-8d08-a1b8a2d4284e___Mary_HL 9148.JPG |
raw/color/Raspberry___healthy/c43f2be4-4d7d-4f36-9aaa-4b031ef1c2e1___Mary_HL 9149.JPG |
raw/color/Raspberry___healthy/dd14b50c-230e-4d4e-aaad-7e7c9c856503___Mary_HL 9146.JPG |
raw/color/Raspberry___healthy/9fc0d788-9c2b-4067-ba69-3aca330fd389___Mary_HL 9145.JPG |
raw/color/Raspberry___healthy/d82bc515-0d21-4244-892d-3d2c4ced252a___Mary_HL 6380.JPG |
raw/color/Raspberry___healthy/dd97d1bf-56e2-46e2-b45d-43355ce1faa7___Mary_HL 6382.JPG |
raw/color/Raspberry___healthy/c7d0d034-94b5-4b25-b899-d571649786b5___Mary_HL 6386.JPG |
raw/color/Raspberry___healthy/bc837901-a8c4-4dc2-991c-3a467fa234e1___Mary_HL 6385.JPG |
raw/color/Raspberry___healthy/b2779283-7f45-4c50-97b5-bfca3c2a87d2___Mary_HL 6387.JPG |
raw/color/Raspberry___healthy/5cb1014e-dd7c-4d7b-8e8f-23326179dc23___Mary_HL 6383.JPG |
raw/color/Raspberry___healthy/bc82bae8-9be5-4035-afd4-35332a362030___Mary_HL 6384.JPG |
raw/color/Raspberry___healthy/cbc8918e-c03b-4689-9cfb-6b430c464938___Mary_HL 6381.JPG |
raw/color/Raspberry___healthy/fc261eca-1110-4cd3-ae1b-a969680c9550___Mary_HL 6379.JPG |
raw/color/Raspberry___healthy/1588fdc0-3aa4-4c75-b813-7a62780136ad___Mary_HL 9186.JPG |
raw/color/Raspberry___healthy/cfa94853-c6b9-4f40-a8ae-9120269066c4___Mary_HL 9182.JPG |
raw/color/Raspberry___healthy/5d8f148c-224f-4913-bd33-fdb6c9b31fe5___Mary_HL 9189.JPG |
raw/color/Raspberry___healthy/9a4957bc-bd39-4ff2-9b28-0bb6bf6b58a0___Mary_HL 9179.JPG |
raw/color/Raspberry___healthy/1e954b37-9988-4554-bb78-d7180e427d36___Mary_HL 9178.JPG |
raw/color/Raspberry___healthy/4dda7e89-6d44-4c5d-bec2-ba5f3b6818c1___Mary_HL 9181.JPG |
raw/color/Raspberry___healthy/54859da6-2914-4e24-966a-bbc94c072abc___Mary_HL 9184.JPG |
raw/color/Raspberry___healthy/d7abcece-f573-4820-8593-7a210f09ba28___Mary_HL 9183.JPG |
raw/color/Raspberry___healthy/934ad228-1dda-4709-890f-24828468f4e2___Mary_HL 9180.JPG |
raw/color/Raspberry___healthy/bcb2779d-a894-410f-a45b-c46b8b2d3412___Mary_HL 9185.JPG |

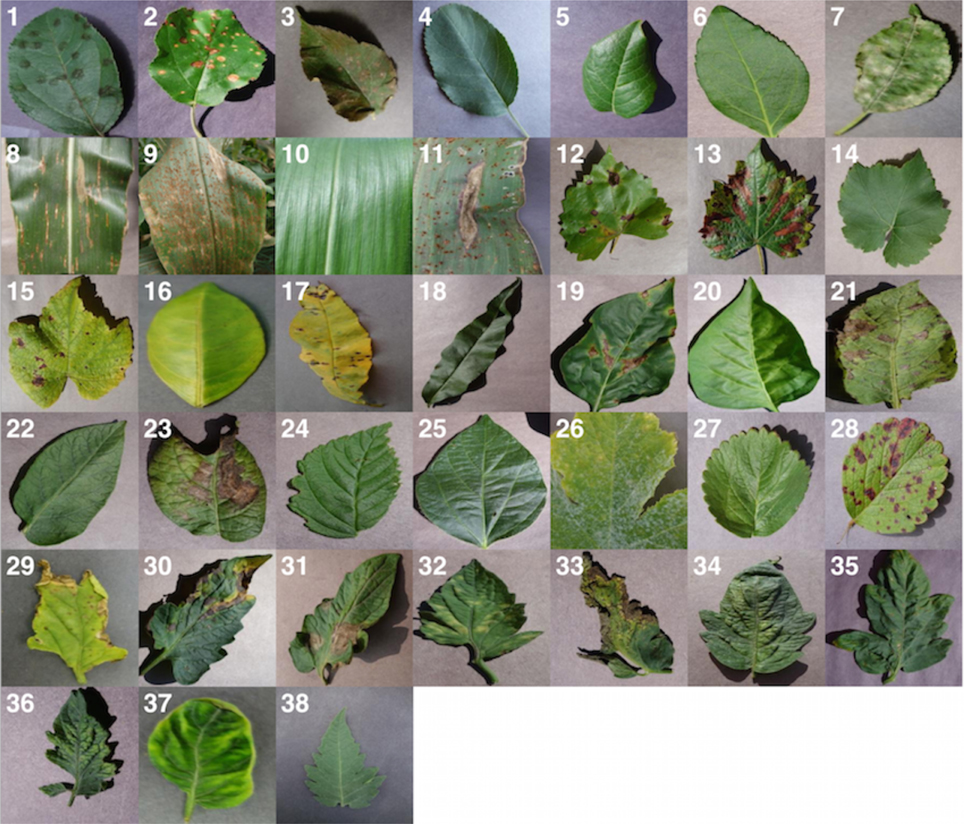
The PlantVillage Dataset is an open access repository of 54,306 images of healthy and diseased plant leaves, collected to advance research in automated plant disease diagnosis. It covers 14 crop species and 26 diseases.
This dataset was introduced in the paper "Using Deep Learning for Image-Based Plant Disease Detection" by Mohanty et al. (2016).
The dataset comes with pre-defined 80/20 train/test splits that preserve the leaf grouping logic (ensuring images of the same leaf do not appear in both sets).
from datasets import load_dataset

# Load the default configuration (color images)
# This automatically downloads the train and test splits.
dataset = load_dataset("mohanty/PlantVillage", "color")

print(dataset)
# DatasetDict({
#     train: Dataset({ features: [...], num_rows: 43596 }),
#     test: Dataset({ features: [...], num_rows: 10709 })
# })
You can choose from three configurations depending on your needs:
| Configuration | Description | Usage |
|---|---|---|
color |
Original RGB images (Default) | load_dataset("mohanty/PlantVillage", "color") |
grayscale |
Grayscale versions | load_dataset("mohanty/PlantVillage", "grayscale") |
segmented |
Background removed, leaf segmented | load_dataset("mohanty/PlantVillage", "segmented") |
Note: The dataset already includes a standard train/test split (as shown in Quick Start), which is recommended for benchmarking. The instructions below are only for advanced users who require custom cross-validation folds.
If you require a different split ratio or cross-validation scheme, you must strictly respect the leaf_id to prevent data leakage. Multiple images often capture the same physical leaf; separating them across train/test sets will bias your evaluation.
Here is a complete example of how to reshuffle and split the dataset 80/20:
import numpy as np
from datasets import load_dataset, concatenate_datasets

# 1. Load the full dataset (combining default train/test splits)
dataset = load_dataset("mohanty/PlantVillage", "color")
full_dataset = concatenate_datasets([dataset["train"], dataset["test"]])

# 2. Get unique leaf IDs representing physical leaves
all_leaf_ids = np.unique(full_dataset["leaf_id"])

# 3. Shuffle and Split Leaf IDs (e.g., 80% train, 20% test)
np.random.seed(42)
np.random.shuffle(all_leaf_ids)

split_ratio = 0.8
split_idx = int(len(all_leaf_ids) * split_ratio)

train_leaf_ids = set(all_leaf_ids[:split_idx])
test_leaf_ids = set(all_leaf_ids[split_idx:])

# 4. Filter the full dataset to create new splits
# This ensures all images of a specific leaf are exclusively in one split
custom_train = full_dataset.filter(lambda x: x["leaf_id"] in train_leaf_ids)
custom_test = full_dataset.filter(lambda x: x["leaf_id"] in test_leaf_ids)

print(f"Custom Train Size: {len(custom_train)}")
print(f"Custom Test Size: {len(custom_test)}")
image: PIL Image.label: Class label (e.g., Apple___Black_rot).leaf_id: Unique identifier for the physical leaf. crop: Crop name.disease: Disease name.@article{Mohanty_Hughes_Salathé_2016,
title = {Using deep learning for image-based plant disease detection},
volume = {7},
DOI = {10.3389/fpls.2016.01419},
journal = {Frontiers in Plant Science},
author = {Mohanty, Sharada P. and Hughes, David P. and Salathé, Marcel},
year = {2016},
month = {Sep}
}
Sharada Mohanty sharada.mohanty@epfl.ch
Marcel Salathé Marcel.Salathe@epfl.ch
Digital Epidemiology Lab, EPFL


