
Update README.me
#2
by stivenmosheyoff - opened
README.me
CHANGED
|
@@ -5,143 +5,96 @@ Assignment: EDA & Dataset Analysis
|
|
| 5 |
Dataset Source: Kaggle – UFC Fighters' Statistics Dataset
|
| 6 |
Dataset Size: ~4,112 rows × 18 column
|
| 7 |
|
| 8 |
-
|
| 9 |
-
|
| 10 |
-
|
| 11 |
-
# Ski Resorts Worldwide - Exploratory Data Analysis (EDA)
|
| 12 |
-
|
| 13 |
-
*Author:* Omer Gonen
|
| 14 |
-
*Course:* Introduction to Data Science
|
| 15 |
-
*Assignment:* EDA & Dataset Analysis
|
| 16 |
-
*Dataset Source:* Kaggle – Ski Resorts Worldwide Dataset
|
| 17 |
-
*Dataset Size:* ~5,478 rows × 33 columns
|
| 18 |
-
|
| 19 |
---
|
| 20 |
|
| 21 |
## Project Goal
|
| 22 |
|
| 23 |
-
The
|
| 24 |
-
|
| 25 |
|
| 26 |
---
|
| 27 |
|
| 28 |
## Dataset Overview
|
| 29 |
|
| 30 |
-
The dataset contains information about
|
| 31 |
-
|
| 32 |
-
- *
|
| 33 |
-
- *
|
| 34 |
-
- *
|
| 35 |
-
- *
|
| 36 |
-
- *
|
| 37 |
-
- *
|
| 38 |
-
- *
|
| 39 |
-
- *
|
| 40 |
-
- *
|
| 41 |
-
- *
|
| 42 |
-
- *
|
| 43 |
-
|
| 44 |
-
|
|
|
|
|
|
|
|
|
|
|
|
|
|
|
|
|
|
|
| 45 |
|
| 46 |
---
|
| 47 |
|
| 48 |
## Data Cleaning Summary
|
| 49 |
|
| 50 |
-
- Selected
|
| 51 |
-
-
|
| 52 |
-
-
|
| 53 |
-
-
|
| 54 |
-
-
|
| 55 |
-
-
|
| 56 |
-
-
|
| 57 |
-
-
|
| 58 |
-
- Final dataset: *2,338 valid resorts* for analysis (42.7% retention rate).
|
| 59 |
|
| 60 |
---
|
| 61 |
|
| 62 |
## Research Questions & Insights
|
| 63 |
|
| 64 |
|
| 65 |
-
### *Q1:
|
|
|
|
|
|
|
| 66 |
|
| 67 |
-
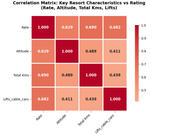
*Visualization: Correlation Heatmap of Key Variables*
|
| 68 |
-
|
| 69 |
|
| 70 |
Click on the image above to view it in full size
|
| 71 |
|
| 72 |
*Insight:*
|
| 73 |
-
*Total Kilometers demonstrates the strongest correlation with resort ratings (r = 0.690)*, followed by Lifts & Cable Cars (r = 0.682) and Altitude (r = 0.629).
|
| 74 |
|
| 75 |
-
This indicates that resort size is the most important predictor of resort quality. Larger resorts with more trail kilometers offer greater variety and options for skiers of all skill levels. Infrastructure (lifts) and elevation also play significant roles, with all three factors showing strong positive correlations with quality ratings.
|
| 76 |
|
| 77 |
---
|
| 78 |
|
| 79 |
-
### *Q2:
|
|
|
|
| 80 |
|
| 81 |
-
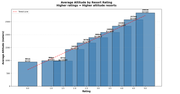
*Visualization: Average Altitude by Resort Rating*
|
| 82 |
-
|
| 83 |
|
| 84 |
Click on the image above to view it in full size
|
| 85 |
|
| 86 |
*Insight:*
|
| 87 |
-
There is a *clear, strong positive relationship between altitude and resort quality*.
|
| 88 |
|
| 89 |
-
- *Lowest-rated resorts* (Rating ≤ 2.0): Average altitude ~1,300 meters
|
| 90 |
-
- *Highest-rated resorts* (Rating = 5.0): Average altitude ~1,900 meters
|
| 91 |
-
- *Altitude difference: Approximately **600 meters (46% increase)*
|
| 92 |
|
| 93 |
-
Higher-elevation resorts consistently receive better ratings. This substantial elevation difference translates to better snow quality, reliability, and overall skiing conditions. The correlation between altitude and rating is strong (r = 0.629).
|
| 94 |
|
| 95 |
---
|
| 96 |
|
| 97 |
-
### *Q3:
|
|
|
|
| 98 |
|
| 99 |
-
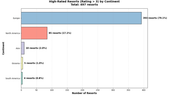
*Visualization: High-Rated Resorts (Rating > 3) by Continent*
|
| 100 |
-
|
| 101 |
|
| 102 |
-
Click on the image above to view it in full size
|
| 103 |
-
|
| 104 |
-
*Insight:*
|
| 105 |
-
*Europe dominates the high-quality ski resort market, accounting for **79.1% of all top-rated resorts* (393 out of 497).
|
| 106 |
-
|
| 107 |
-
- *Europe*: 393 resorts (79.1%)
|
| 108 |
-
- *North America*: 85 resorts (17.1%)
|
| 109 |
-
- *Asia*: 10 resorts (2.0%)
|
| 110 |
-
- *Oceania*: 5 resorts (1.0%)
|
| 111 |
-
- *South America*: 4 resorts (0.8%)
|
| 112 |
-
|
| 113 |
-
This geographic concentration suggests that European regions possess unique advantages for ski resort development—including Alpine geography, consistent snow conditions, established ski culture, and mature infrastructure.
|
| 114 |
|
| 115 |
---
|
| 116 |
|
| 117 |
## Final Conclusions
|
| 118 |
|
| 119 |
*Main Research Question:*
|
| 120 |
-
"How do physical terrain characteristics—including altitude, total trail kilometers, and number of lifts and cable cars—affect ski resort quality ratings?"
|
| 121 |
|
| 122 |
-
*Answer:
|
| 123 |
|
| 124 |
### Key Findings:
|
| 125 |
|
| 126 |
-
1. *Resort size is the dominant quality predictor*
|
| 127 |
-
- Total kilometers show the strongest correlation with ratings (r = 0.690)
|
| 128 |
-
- Larger resorts offer more variety and options for different skill levels
|
| 129 |
-
- More trails = better experience and higher satisfaction
|
| 130 |
-
|
| 131 |
-
2. *Infrastructure quality is critically important*
|
| 132 |
-
- Number of lifts shows very strong correlation (r = 0.682)
|
| 133 |
-
- More lifts = better accessibility, reduced wait times, and improved experience
|
| 134 |
-
- Modern lift systems are essential for high ratings
|
| 135 |
-
|
| 136 |
-
3. *Altitude significantly affects quality*
|
| 137 |
-
- Elevation shows strong correlation with ratings (r = 0.629)
|
| 138 |
-
- Top-rated resorts average 600m higher elevation
|
| 139 |
-
- Higher altitude = better snow quality and longer seasons
|
| 140 |
-
|
| 141 |
-
4. *Geographic concentration of quality*
|
| 142 |
-
- Europe leads with 79% of high-rated resorts
|
| 143 |
-
- Location matters: certain regions have natural and infrastructural advantages
|
| 144 |
-
|
| 145 |
|
| 146 |
### Overall Insights:
|
| 147 |
- All three physical terrain characteristics show strong positive correlations with quality
|
|
@@ -154,4 +107,3 @@ This geographic concentration suggests that European regions possess unique adva
|
|
| 154 |
|
| 155 |
## Video
|
| 156 |
|
| 157 |
-
[[Video link placeholder]](https://www.loom.com/share/e6da147bbe49433f81f283b9932511db)
|
|
|
|
| 5 |
Dataset Source: Kaggle – UFC Fighters' Statistics Dataset
|
| 6 |
Dataset Size: ~4,112 rows × 18 column
|
| 7 |
|
|
|
|
|
|
|
|
|
|
|
|
|
|
|
|
|
|
|
|
|
|
|
|
|
|
|
|
|
|
|
|
|
|
| 8 |
---
|
| 9 |
|
| 10 |
## Project Goal
|
| 11 |
|
| 12 |
+
The Project Goal was answer the question : What are the defining attributes—both physiological
|
| 13 |
+
(physical) and strategic (fighting style)—that characterize the ultimate mixed martial arts fighter?
|
| 14 |
|
| 15 |
---
|
| 16 |
|
| 17 |
## Dataset Overview
|
| 18 |
|
| 19 |
+
The dataset contains information about UFC Fighters winrate with the following key columns:
|
| 20 |
+
|
| 21 |
+
- **name**
|
| 22 |
+
- **height_cm**
|
| 23 |
+
- **weight_in_kg**
|
| 24 |
+
- **stance**
|
| 25 |
+
- **Age**
|
| 26 |
+
- **reach_in_cm** - Arm span length (cm)
|
| 27 |
+
- **stance**
|
| 28 |
+
- **Strikes/Min** - significant_strikes_landed_per_minute
|
| 29 |
+
- **Strike Accuracy** - significant_striking_accuracy
|
| 30 |
+
- **Absorb/Min** - significant_strikes_absorbed_per_minute
|
| 31 |
+
- **Strike Defense** - significant_strike_defence
|
| 32 |
+
- **Takedowns/Fight** - average_takedowns_landed_per_15_minutes
|
| 33 |
+
- **TD Defense** - takedown_defense
|
| 34 |
+
- **Submissions/Fight** - average_submissions_attempted_per_15_minutes
|
| 35 |
+
- **TD Accuracy** - takedown_accuracy
|
| 36 |
+
- **total_fights**
|
| 37 |
+
- **win_rate**
|
| 38 |
+
|
| 39 |
+
The final dataset is the result of systematic cleaning, validation, and filtering procedures
|
| 40 |
|
| 41 |
---
|
| 42 |
|
| 43 |
## Data Cleaning Summary
|
| 44 |
|
| 45 |
+
- Selected 13 relevant columns from the original 18 columns for analysis, and subsequently engineered 3 new features.
|
| 46 |
+
- Handling Non-Informative & Duplicates
|
| 47 |
+
- Missing Value Handling, Removing Fighters with 3 or More Missing Columns
|
| 48 |
+
- Filtering 3 Fighters Due to Missing Height Data
|
| 49 |
+
- Filtering Fighters with Missing Date of Birth
|
| 50 |
+
- Filling Missing 'Reach' Values with the Mean
|
| 51 |
+
- Filling Missing 'Stance' Values with 'Unknown
|
| 52 |
+
- Column Renaming for Readability
|
|
|
|
| 53 |
|
| 54 |
---
|
| 55 |
|
| 56 |
## Research Questions & Insights
|
| 57 |
|
| 58 |
|
| 59 |
+
### *Q1: "Is the fighter's Age a statistically significant factor in predicting the Win Rate, and what is the central tendency
|
| 60 |
+
(mean) of the age distribution in the dataset?
|
| 61 |
+
|
| 62 |
|
|
|
|
|
|
|
| 63 |
|
| 64 |
Click on the image above to view it in full size
|
| 65 |
|
| 66 |
*Insight:*
|
|
|
|
| 67 |
|
|
|
|
| 68 |
|
| 69 |
---
|
| 70 |
|
| 71 |
+
### *Q2: "Is there a correlation between a physical variable or fighting style with the Win rate?"
|
| 72 |
+
|
| 73 |
|
|
|
|
|
|
|
| 74 |
|
| 75 |
Click on the image above to view it in full size
|
| 76 |
|
| 77 |
*Insight:*
|
|
|
|
| 78 |
|
|
|
|
|
|
|
|
|
|
| 79 |
|
|
|
|
| 80 |
|
| 81 |
---
|
| 82 |
|
| 83 |
+
### *Q3: "Given that a fighter possesses all the 'aggressive' attributes with a positive correlation to victory, are these traits sufficient,
|
| 84 |
+
on their own, to reliably predict or guarantee a high Win Rate, or are other factors more decisive?"
|
| 85 |
|
|
|
|
|
|
|
| 86 |
|
|
|
|
|
|
|
|
|
|
|
|
|
|
|
|
|
|
|
|
|
|
|
|
|
|
|
|
|
|
|
|
|
|
|
|
|
| 87 |
|
| 88 |
---
|
| 89 |
|
| 90 |
## Final Conclusions
|
| 91 |
|
| 92 |
*Main Research Question:*
|
|
|
|
| 93 |
|
| 94 |
+
*Answer:
|
| 95 |
|
| 96 |
### Key Findings:
|
| 97 |
|
|
|
|
|
|
|
|
|
|
|
|
|
|
|
|
|
|
|
|
|
|
|
|
|
|
|
|
|
|
|
|
|
|
|
|
|
|
|
|
|
|
|
|
|
|
|
|
|
|
|
|
|
|
|
|
|
|
| 98 |
|
| 99 |
### Overall Insights:
|
| 100 |
- All three physical terrain characteristics show strong positive correlations with quality
|
|
|
|
| 107 |
|
| 108 |
## Video
|
| 109 |
|
|
|