Airbnb NYC Price Analysis and Classification Project
Overview
This project analyzes Airbnb listings in New York City. The primary goal was to predict listing prices and classify properties into price tiers (Low, Medium, High). The project demonstrates a full Data Science lifecycle: from rigorous data cleaning and EDA to training regression and classification models, identifying critical data leakage, and performing unsupervised clustering.
Workflow and Key Findings
The notebook follows these main steps:
- Data Cleaning: Removing currency symbols, handling missing values, and type conversion.
- EDA: Visualizing correlations which hinted at data leakage via the 'service_fee' feature.
- Regression (Baseline): Establishing a baseline model which performed suspiciously well due to the leakage.
- Classification: Retraining models after removing the leaking feature to reveal the true predictive power of physical attributes.
- Clustering: Segmenting the market using K-Means.
1. Exploratory Data Analysis (EDA)
We started by examining the distribution of data and relationships between variables. The heatmap was particularly revealing.
Visualizations: Correlation and Distributions


Key Insight: The perfect correlation between 'price' and 'service_fee' was the first indicator that 'service_fee' is a direct derivative of the target variable, leading to data leakage.
2. Regression Modeling (Baseline)
Model Setup
- Regression Goal: The goal is to predict the daily price (continuous variable) of an Airbnb listing in NYC based on its numeric attributes (reviews, availability, location coordinates, etc.).
- Feature Selection (Baseline): For the baseline model, we will use only the numeric features available in the dataset to establish a starting point.
- Features (X):
service_fee,minimum_nights,number_of_reviews,reviews_per_month,review_rate_number,calculated_host_listings_count,availability_365,construction_year,lat,long. - Target (y):
price
- Features (X):
- Train-Test Split: We will split the data into 80% training set and 20% testing set using a random seed for reproducibility.
- Model Training: We will use a standard LinearRegression model from Scikit-Learn with default parameters.
Model Performance & Results
The graphs below show the actual vs. predicted prices and the feature importance based on the setup above.


Observation: The RMSE is extremely low (~$25), and the R2 score is very high. While this looks great, it raises a suspicion of potential data leakage (overfitting to a specific feature). We will investigate this further in the Classification section.
3. Classification and Leakage Correction
To build a realistic model, we defined three price classes: Low, Medium, and High. We then removed the service_fee feature and retrained the models.
The Reality Check Without the leaked information, the accuracy dropped to ~33% across all models. This indicates that physical features alone (like neighbourhood or room type) are not sufficient to linearly separate price tiers in this specific dataset.
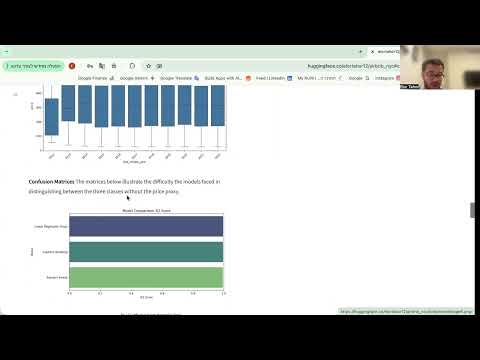
Model Comparison We compared Logistic Regression, Decision Tree, and KNN.

Confusion Matrices The matrices below illustrate the difficulty the models faced in distinguishing between the three classes without the price proxy.


Selected Model: Logistic Regression was chosen as the final model due to its stability and F1-Score compared to the others.
4. Clustering (Unsupervised Learning)
We applied K-Means clustering to identify inherent groups in the data based on location and property attributes.
Cluster Analysis The visualizations below show the segmentation of NYC listings.


Conclusion
- Data Integrity: The project highlights the importance of scrutinizing "too good to be true" results. Removing the
service_feeleakage was critical for model validity. - Predictive Power: The remaining features have low predictive power for price classification, suggesting the need for external data (e.g., precise location scoring, image quality analysis, or sentiment analysis of reviews).
- Final Deliverable: A robust pipeline that correctly preprocesses data and a deployed Logistic Regression baseline model.
How to Use the Model
import pickle
import pandas as pd

# Load the trained model
with open("classification_model.pkl", "rb") as f:
    model = pickle.load(f)
Video Presentation