
Spaces:
Running

Let GENCO predict the change, not the state: contingency screening with the anchored change start and one Newton step

Author: Kehan Liu, independent entry (public data only). Contact: kehan_liu@outlook.com.
Code, results and the full report: github.com/KehanLiu/genco-anchored-screening (MIT). This post is the short version; the full write-up with every table and the appendix is submission/POST.md in that repository.
In brief. In a complete N-1 analysis of the GOC 2000 grid, GENCO on its own misses 54% of the outages that overload a line. Used differently, it helps. Start Newton's method from the pre-outage AC solution plus the change GENCO predicts for the outage, take one step, and send to the full AC solver only what that step flags. On a fresh pool of 76,512 outages, with every rule frozen before the pool existed, this screen referred 1,658 outages (2.17%) to the full solver and missed one critical outage; the classical one-step screen referred 21,376 (27.94%) and missed two. The two screens use separately calibrated residual thresholds, so one miss against two is not evidence of better safety. There is no wall-clock gain on our hardware: one GENCO inference costs about as much as three Newton iterations. What GENCO buys is fewer calls to the full solver, on grids up to 2,000 buses, and we show where that stops.
The contribution, precisely
The organisers' example (discussion #1) screens GOC 500 with GENCO Tiny against a DC baseline, and the GENCO paper envisions a "safeguarded hybrid workflow" with "re-evaluation with a classical AC solver" (section 6). We built that workflow and measured it against the baseline an operator already has: contingency analysis starts from a solved AC base case, so the fair comparison is one Newton step from that same base case. That is classic single-iteration screening (Albuyeh, Bose and Heath, 1982), and it ties any start from GENCO's own state at 2,000 buses and beats it at 10,000.
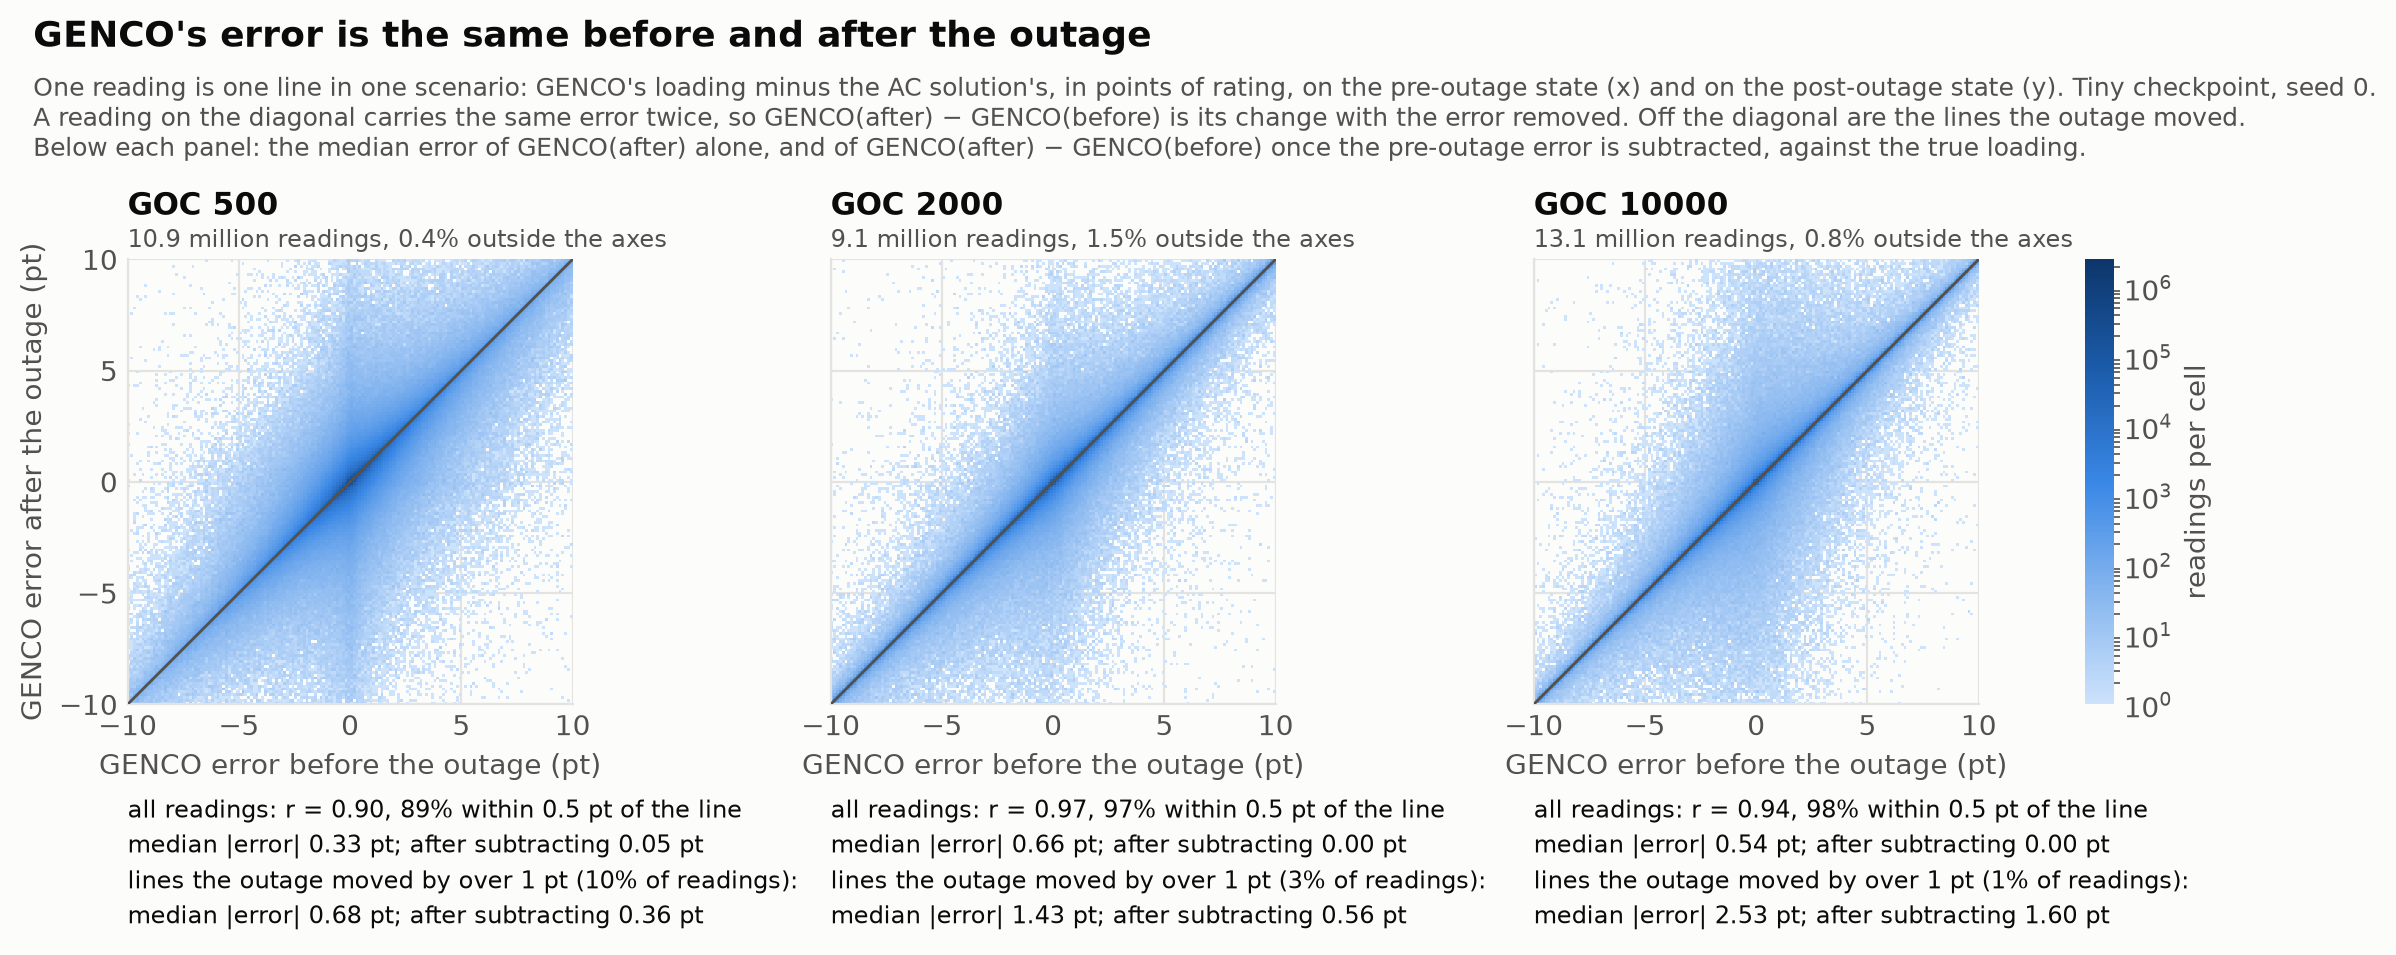
What GENCO can add is its predicted change. On Texas 2000, 97% of GENCO's errors above 3 points of loading occur at one load level, on the same lines in every state: the error is largely systematic. So the start we propose is
pre-outage AC voltages + [GENCO(after outage) − GENCO(before outage)], then one Newton step.
Most of the systematic error cancels in the difference. On lines whose loading moves by more than one point, the predicted change removes 85% of the median error of assuming no change on GOC 500 and 74% on GOC 2000. The start's median power mismatch is 6 MW on those grids, against 72–118 MW for the pre-outage solution and 246–435 MW for GENCO's own state. It needs two inferences, one of which is shared by every outage of a base case, one Newton step, and no training.
Main comparison: fresh operating points, frozen policies
The screening rule is: after one Newton step, refer the outage to the full solver if any line loading exceeds the cutoff (100.1%) or the remaining power mismatch exceeds a threshold. The thresholds were chosen on an earlier GOC 2000 N-1 study, with the same objective for each workflow (the largest threshold with no missed critical outage on six calibration bases), which gave 0.5 MW for the classical start and 5 MW for the anchored start. We then froze every threshold, cushion and gate (work/fresh/policy_frozen.json, with a dated log) and generated a fresh GOC 2000 pool: six registered bases, extended by 18 more after the fresh hybrid-start outcomes had been seen but before any fresh N-1 outcome was inspected, with the policies unchanged (the dated log records both), 24 bases and 76,512 non-islanding single-branch outages in all, of which 1,510 are critical. Every policy variant is reported in the repository; none was chosen on these results.
| Fresh pool, 24 bases, 76,512 outages, 1,510 critical | Referred to full AC | Critical outages missed | Newton iterations vs complete AC |
|---|---|---|---|
| Complete AC for every outage | 76,512 (100%) | 0 | 100% |
| Classical screen: one step from the pre-outage solution, threshold 0.5 MW | 21,376 (27.94%) | 2 | 55.6% |
| Anchored change start, one step, threshold 5 MW | 1,658 (2.17%) | 1 | 37.1% |
On the six registered bases alone both screens missed zero critical outages. Two things must be read next to this table.
- The thresholds differ, so the miss counts are not a safety comparison. Each screen keeps its own residual threshold from the earlier calibration, and a residual tolerance in MW is not proportional to a loading tolerance. One miss against two is within what those thresholds allow and does not show that the anchored screen is safer.
- At matched misses, on the old test bases, the gap in referrals remains. A sensitivity sweep over the threshold on the earlier study's 18 test bases (57,384 outages; exploratory, not fresh confirmation) gives, at two missed critical outages each, 13.00% referred for the anchored screen against 49.23% for the classical screen; at zero misses each, 26.09% against 84.54%. The fresh pool confirms the referral cut at the frozen thresholds; it does not re-establish these matched-miss numbers.
In operator terms, 2.17% referred is about one full AC solve per 46 outages, against about one per 4 for the classical screen. MISO "evaluates on the order of 10,000 contingencies every few minutes" (IBM Research blog); the saving is in solver calls, not in seconds.
Timing: no wall-clock gain
On a separate timing sample from the same pool (4,800 outages, 200 per base, 69 critical), all three workflows missed zero critical outages, and the measured throughput on this laptop was:
| Workflow (same 4,800 outages) | Measured ms per outage |
|---|---|
| Complete AC, Newton to convergence from the pre-outage solution | 13.7 |
| Classical screen, one Newton step from the pre-outage solution | 8.4 |
| Anchored change start, one Newton step, GENCO Tiny on the laptop GPU in batches of 16 | 22.3 |
Per outage the anchored workflow needs 1.08 Newton iterations on average, against 2.92 for complete AC and 1.61 for the classical screen, but it adds one forward pass (12.74 ms at batch 16) and one graph build (2.40 ms). The forward pass would have to cost about 4.4 ms or less, with the current graph builder, for the estimate to break even against complete AC. These are single-process laptop measurements; complete AC and the classical screen parallelise across CPU cores and were not given that advantage. The full report states the conditions under which the cost side could change and what we did not measure.
Where you start decides what one step finds
The same mechanism on scenarios with up to five random branch outages (gridfm-datakit), scored against the full AC solution, loading-only cutoff 100.1%, released checkpoints:
| Grid (overloaded lines) | Pre-outage solution: missed / secure scenarios flagged | GENCO's state: missed / flagged | Anchored change start: missed / flagged |
|---|---|---|---|
| IEEE 118 (6,986) | 74 / 1.9% | 4 / 0.0% | 2 / 0.0% |
| GOC 500 (2,621) | 41 / 0.2% | 9 / 0.1% | 5 / 0.0% |
| GOC 2000 (369) | 2 / 0.0% | 1 / 0.6% | 0 / 0.0% |
| GOC 10000 (507), Tiny | 2 / 0.3% | 7 / 37.0% | 5 / 3.2% |
| GOC 10000 (507), Small | 2 / 0.3% | 6 / 28.2% | 2 / 2.1% |
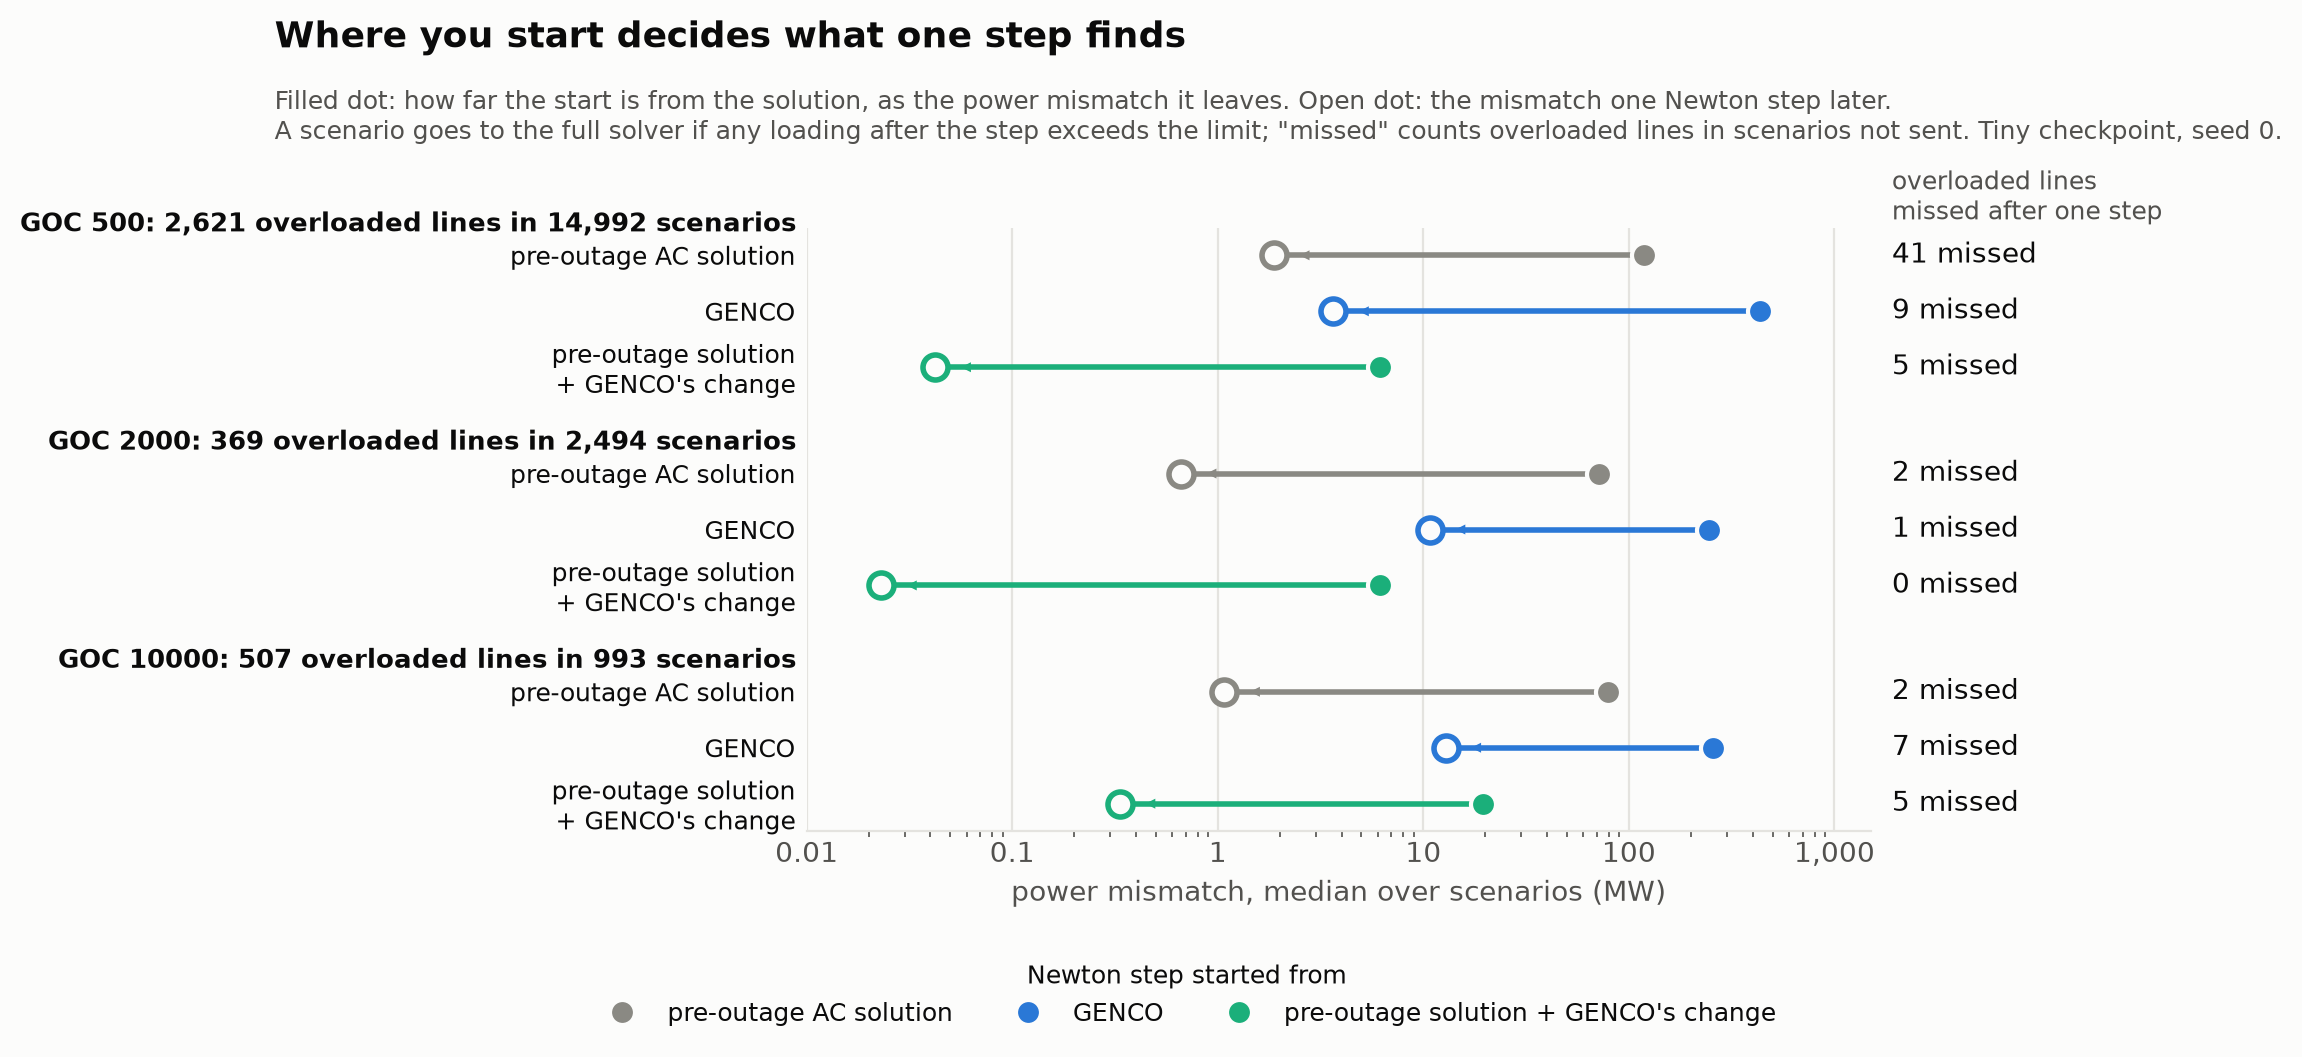
The Newton step is essential. Without it, the anchored change alone misses 14–44% of overloaded lines. The step finds the overloads; GENCO improves where the step begins.
Where it stops working
- 10,000 buses. No released checkpoint beats the classical start. It misses 2 lines; the anchored start with Tiny seed 0, Tiny seed 1, Small seed 0 and Small seed 1 misses 5, 3, 2 and 3, and the best of them refers about seven times as many secure scenarios (2.1% against 0.3%). On this grid the predicted change removes only 28–39% of the no-change error.
- Fine-tuning does not change it. Released Tiny checkpoints fine-tuned on new multi-outage scenarios, up to two hours per grid on a laptop GPU: GOC 10000 goes from 5 to 4 missed at 3.2% flagged; on GOC 500 the raw error falls from 0.33 to 0.23 points, yet after one Newton step nothing changes (5 → 5).
- Reactive limits. With PV-to-PQ switching in the reference solution, lines missed on GOC 500 are 23 (anchored change), 28 (GENCO's state) and 54 (pre-outage) of 2,570. The ranking holds; "almost nothing missed" does not. A finding we withdraw: GENCO's 98.8% detection of voltage-limit violations on IEEE 118 becomes 52–70% against the limit-enforced truth.
- The base state is assumed. We start from a converged AC base state consistent with the injections, controls and network model of the contingency. Sensitivity to state-estimation error, stale operating points and topology uncertainty was not tested.
- The mismatch gate is a heuristic, not a bound on loading error. The 14 outages the anchored screen missed in the earlier N-1 study left a median mismatch of 0.5 MW, under the 5 MW threshold. Misses are counted, never bounded.
Tools, code and what can be checked
- GENCO checkpoints from
gridfm/genco-pf-datakit(IEEE 118, GOC 500, GOC 2000, GOC 10000 Tiny and Small),gridfm/genco-pf-contingency(Texas 2000) andgridfm/genco-pf-transfer; gridfm-graphkit for inference; gridfm-datakit for scenario generation and the AC, DC and OPF solves. Inputs are fetched by commit sha and verified against a sha256 manifest. - The repository holds every analysis script, the summary tables (
results/) and figures,gridtrust(a numpy/scipy/pandas package with the Newton refinement, the conformal band and the staged decision, 41 tests) and a draft contribution to gridfm-graphkit (upstream/, anewton_refinehook, not yet submitted). - From a clean clone: setup, data fetch with checksums, the tests, and
python scripts/headline_numbers.py --check, a registered regression check of 274 numbers of the full report against the summary tables (it does not parse the report; the equivalent-circuit section is outside it). The analysis and figure stages need the saved result tables and the GOC 2000 test and fresh pools, which only the long stages produce (about two days of laptop time, plus about 3 h for the fresh pools and 33 min for the circuit-representation runs). No results archive exists, so a third party cannot repeat the replay without rerunning those stages.README.mdlists what runs at each level.
Relation to other entries
We are glad to see other entries on the same question, and we read them as complementary rather than competing. #7 Trust, but verify by Alireza Shooshtari is the natural second half of this workflow: it wraps GENCO in a verification step that runs Newton to convergence on every case, raises an alarm when no start converges, and studies clustered outages near voltage collapse, where our screen was never tested. Its finding that GENCO under-reacts to system-wide load growth, and the fine-tuning that repairs it, is a model improvement we did not attempt and would like to try as a start for our screen. The two entries also agree on cost: GENCO's start saves about one Newton iteration and inference costs more than the classical solve. What our entry adds alongside it is the pre-outage one-step screen as the comparator and GENCO's predicted change, rather than its state, as the start. #2 GENCO-PTDF audits GENCO's local sensitivities on a fixed topology; a change-based start like ours depends on exactly those sensitivities being right, so its findings are relevant to us. We thank the organisers for the example post (#1), which gave us the setup we reproduced and extended. The literature on learned Newton warm starts and on conformal N-k screening with GridFM is discussed in the full report.