Strength Performance Analysis and Modeling
Overview
This project explores a dataset of athlete strength metrics to understand patterns in deadlift performance and to build models that can predict and classify athletes based on strength.
The workflow includes:
- Exploratory Data Analysis (EDA)
- Feature engineering
- Regression models
- Classification models
- Clustering
- Model selection and export
The final objective was to classify athletes into performance categories and evaluate which model performs best.
Dataset
The dataset contains:
- Body weight
- Height
- Age
- Strength metrics: deadlift, back squat, snatch
After cleaning:
- Duplicate rows were removed
- Placeholder values were replaced
- Unrealistic values were filtered
- Missing key fields were dropped
Exploratory Data Analysis (EDA)
Average Deadlift by Body Weight

Heavier weight groups generally show higher deadlift performance.
Average Deadlift by Height

Taller athletes tend to lift more, with higher variability at the upper height ranges.
Average Deadlift by Age

Performance peaks around ages 25–34 and gradually declines afterward.
Body Ratio and Deadlift

Higher weight-to-height ratios are associated with stronger lifts.
Strength Metric Correlations

Deadlift and back squat show a strong positive correlation, while snatch is only weakly related.
Regression Modeling
A baseline linear regression model was trained to predict deadlift performance.
Actual vs Predicted Deadlift

The model follows the general trend but shows noise due to differences between athletes.
Clustering
K-Means clustering was used to group athletes based on strength metrics.
Cluster Visualization (PCA)

Three performance clusters were identified, separating athletes by overall strength level.
Classification Modeling
Athletes were grouped into three balanced performance classes:
- Low
- Medium
- High
Models trained:
- Logistic Regression
- Random Forest
- Gradient Boosting
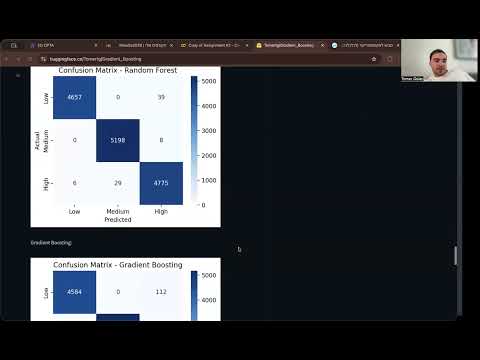
Confusion Matrices
Logistic Regression:

Random Forest:

Gradient Boosting:

Model Evaluation
All models performed well across accuracy, precision, recall, and F1-score.
Random Forest stood out because it:
- Made fewer major misclassifications
- Separated high and low performers better
- Achieved the highest F1-score
Final Model
The final selected model:
Random Forest Classifier
It was trained on the full dataset and exported as:
best_classifier.pkl
How to Load the Model
import pickle

with open("best_classifier.pkl", "rb") as f:
    model = pickle.load(f)

prediction = model.predict(X_sample)
Conclusion
This project provided several key insights:
- Weight, height, and body ratio strongly influence deadlift performance
- Performance peaks in the late 20s and declines afterward
- Deadlift and back squat are closely related
- Classification models performed very well due to clear class separation
- Random Forest proved to be the most reliable model
The work demonstrates a full machine learning workflow, including:
- Data exploration
- Feature engineering
- Model training
- Evaluation
- Model selection
- Export
The final Random Forest model delivers strong performance and can be used to classify athletes into strength categories based on their physical and strength metrics.
Presentation Video