| --- |
| license: cc-by-4.0 |
| language: |
| - en |
| pretty_name: "RDDAC — Real Deep Drawing and Cutting Dataset (Teaser)" |
| size_categories: |
| - n<1K |
| tags: |
| - croissant |
| - experimental-data |
| - measurement |
| - sim-to-real |
| - sim2real |
| - scientific-machine-learning |
| - sciml |
| - sheet-metal-forming |
| - metal-forming |
| - deep-drawing |
| - stamping |
| - cutting |
| - manufacturing |
| - materials-science |
| - process-monitoring |
| - laser-scan |
| - point-cloud |
| - time-series |
| - sensor-data |
| - digital-twin |
| - regression |
| - benchmark |
| - engineering |
| - automotive |
| - hdf5 |
| task_categories: |
| - tabular-regression |
| - time-series-forecasting |
| - other |
| --- |
| # RDDAC — Real Deep Drawing and Cutting Dataset |
|
|
| [](https://opensource.org/licenses/MIT) [](https://creativecommons.org/licenses/by/4.0/) [](https://www.python.org/downloads/) [](https://rddac.readthedocs.io) [](https://darus.uni-stuttgart.de/dataset.xhtml?persistentId=doi:10.18419/DARUS-5589) [](https://doi.org/10.18419/DARUS-5589) |
|
|
|  |
|
|
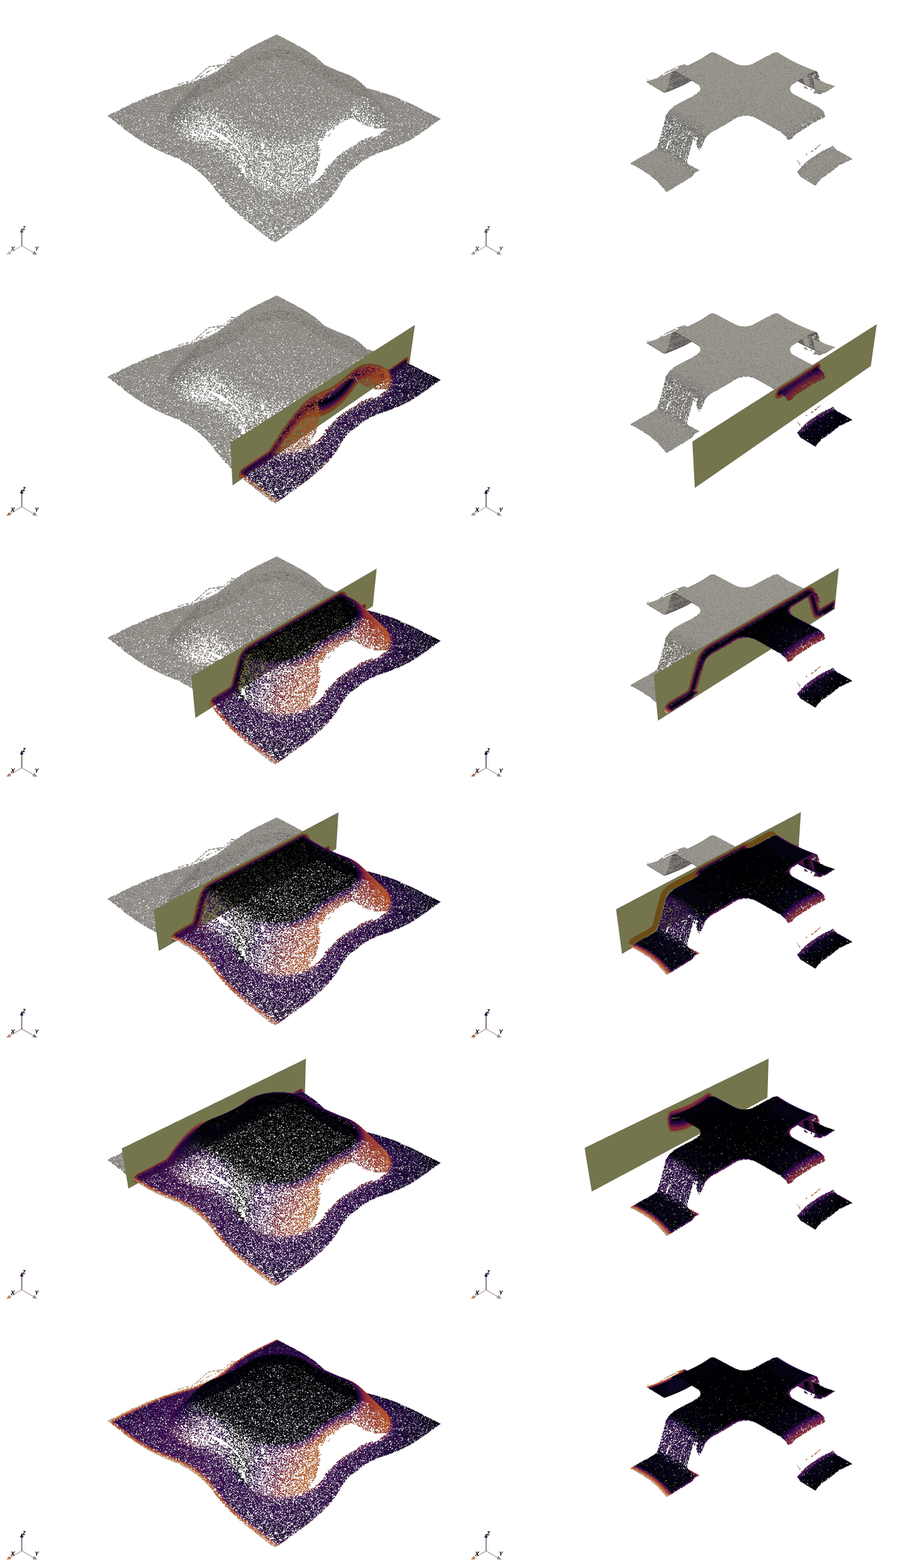
| *Measured point clouds of one experiment after deep drawing (OP10, left) and cutting (OP20, right), colored by the deviation from the matching DDACS simulation.* |
|
|
| **A large-scale experimental dataset of 9,000 physical deep-drawing and cutting experiments — the real-world counterpart to the [DDACS](https://ddacs.readthedocs.io) FEM simulations.** Each experiment forms a modified quadratic cup from DP600 dual-phase steel (deep drawing in OP10, cutting in OP20) and records press force signals, sheet-thickness and oil-film traverses, and high-resolution 3D laser scans of the part after each operation. Use it to quantify the simulation-to-reality gap, train models on real process data, or validate DDACS-trained surrogates against physical measurements. |
|
|
| | | | |
| |---|---| |
| | **Experiments** | 9,000 | |
| | **Total size** | ~87 GB (HDF5, lossless) | |
| | **Process steps per experiment** | 2 (OP10 deep drawing, OP20 cutting) | |
| | **Parameter space** | 2 geometries x 3 blankholder forces x 3 oil types (18 categories) | |
| | **Repetitions** | up to 500 per category | |
| | **Train / val / test** | 7,200 / 900 / 900 (predefined, seed 42) | |
| | **Matching simulations** | DDACS `rddac.zip` (~9 GB), fetched by `rddac download` | |
|
|
| **[Documentation](https://rddac.readthedocs.io)** · **[Dataset DOI](https://doi.org/10.18419/DARUS-5589)** · **[Paper](https://doi.org/10.1007/s12666-026-03870-5)** |
|
|
| ## About this sample |
|
|
| This is a **~174 MB teaser** of RDDAC — 18 experiments (one per category) plus the |
| Croissant 1.1 manifest, the complete process-parameter table, and the six tutorial |
| notebooks — so you can explore the schema and run every tutorial in seconds before |
| committing to the full download. |
|
|
| ``` |
| data/ |
| metadata.json Croissant 1.1 manifest (the dataset schema) |
| process_parameters.csv parameters + splits for all 9,000 experiments |
| h5/sample.zip 18 experiments, one per category (all modalities) |
| rddac_documentation.pdf dataset documentation |
| notebooks/ six end-to-end tutorials (see notebooks/README.md) |
| ``` |
|
|
| **Croissant manifest.** `data/metadata.json` is the |
| [Croissant 1.1](https://mlcommons.org/croissant/) manifest — the machine-readable |
| schema (every HDF5 field and CSV column) that `rddac.load()` and any |
| Croissant-aware tool consume. It is the same manifest published with the full |
| dataset on DaRUS ([doi:10.18419/DARUS-5589](https://doi.org/10.18419/DARUS-5589)). |
|
|
| ## Installation |
|
|
| ```bash |
| pip install rddac # add the PyTorch adapter with: pip install 'rddac[torch]' |
| ``` |
|
|
| ## Basic usage |
|
|
| `rddac.open_h5` opens a single experiment in memory and returns an `h5py.File`; |
| the visualization helpers plot the raw modalities directly. |
|
|
| ```python |
| import rddac |
| |
| # Open one bundled experiment. Four raw modalities per file. |
| with rddac.open_h5(0, data_dir="data") as f: |
| force = f["force/data"][:] # (n, 8): time, load cells, temp, position, total force |
| z = f["pointcloud/op10/z"][:] # (6400000,) flat laser-scan buffer |
| lumi = f["pointcloud/op10/luminescence"][:] |
| |
| # The OP10 scan as a 3D point cloud. |
| points = rddac.scan_to_pointcloud(z, lumi, stride=4) |
| rddac.plot_point_cloud(points, point_size=0.4) |
| ``` |
|
|
| ## PyTorch integration |
|
|
| `RDDACDataset` is a `torch.utils.data.IterableDataset` over a Croissant view. It |
| auto-shards across DataLoader workers and DDP ranks, and silently skips |
| experiments whose zip is missing — so partial downloads (like this teaser) stream |
| cleanly. |
|
|
| ```python |
| from rddac.pytorch import RDDACDataset |
| from torch.utils.data import DataLoader |
| |
| ds = RDDACDataset(view="force-curve", data_dir="data") |
| for batch in DataLoader(ds, batch_size=1, num_workers=0): |
| force = batch["force_data"] |
| break |
| ``` |
|
|
| ## Tutorials |
|
|
| Six end-to-end notebooks ship in `notebooks/` and are published on |
| [Read the Docs](https://rddac.readthedocs.io/en/latest/tutorials/): |
|
|
| 1. **Getting started** — install, inspect one experiment, 3D point cloud plot. |
| 2. **Build your own view** — `rddac.add_view`, manifest inspection, custom RecordSets. |
| 3. **PyTorch training** — `RDDACDataset`, filters, train/val/test splits. |
| 4. **Visualization** — scans, point clouds, force curves, traverses. |
| 5. **Loose HDF5 recipe** — pandas + `h5py` after `--extract --remove-zip`. |
| 6. **Streaming & numpy export** — `iter_view`, `export_to_numpy`. |
|
|
| ## Relationship to DDACS |
|
|
| RDDAC is the experimental counterpart to the [DDACS](https://ddacs.readthedocs.io) |
| simulation dataset: same cup geometry, same DP600 steel, same two-stage OP10/OP20 |
| process. The matching FEM simulations are published in the DDACS dataset as |
| `rddac.zip` (~9 GB); `rddac download` fetches them alongside the measurements. The |
| `rddac` package API mirrors `ddacs` one to one, so analysis code moves between |
| simulation and experiment by swapping the import. |
|
|
| ## ⬇️ Get the full dataset |
|
|
| **This sample contains 18 of 9,000 experiments.** The complete RDDAC dataset — |
| **9,000 experiments, ~87 GB of lossless HDF5**, with the predefined |
| 7,200 / 900 / 900 train/val/test split — is hosted on DaRUS with a citable DOI: |
|
|
| ### ➡️ https://doi.org/10.18419/DARUS-5589 |
|
|
| Everything you ran here scales to the full release unchanged — just point the same |
| code at the full download, or let the package fetch it: |
|
|
| ```bash |
| pip install rddac |
| rddac download # full release (rddac download --small for this sample) |
| ``` |
|
|
| ## Citation |
|
|
| If you use this dataset or code in your research, please cite both the dataset and the paper: |
|
|
| ```bibtex |
| @dataset{baum2026rddac, |
| title={Real Deep Drawing and Cutting Dataset}, |
| author={Baum, Sebastian and Heinzelmann, Pascal}, |
| year={2026}, |
| publisher={DaRUS}, |
| doi={10.18419/DARUS-5589} |
| } |
| |
| @article{baum2026deviation, |
| title={Statistical Analysis of Simulation to Reality Deviation in Deep Drawing with a Benchmark Dataset}, |
| author={Baum, Sebastian and Heinzelmann, Pascal and Clau{\ss}, P. and others}, |
| journal={Transactions of the Indian Institute of Metals}, |
| volume={79}, |
| pages={176}, |
| year={2026}, |
| doi={10.1007/s12666-026-03870-5} |
| } |
| ``` |
|
|
| ## License |
|
|
| Data: **CC BY 4.0**. Package code: MIT. |
|
|

