Spaces:
Runtime error


Runtime error

| # ChessEcon: A Visual Guide to the Autonomous Chess Economy | |
| **Author:** Adaboost AI | |
| **Date:** March 03, 2026 | |
| --- | |
| ## Introduction | |
| This document provides a comprehensive visual overview of the **ChessEcon** system, a multi-agent reinforcement learning platform where AI agents operate as autonomous businesses. The following diagrams and charts illustrate the system's architecture, the flow of information and money, the agent decision-making process, and the dynamics of the training loop. These visualizations are designed to clarify the inter-workings of the agents and the training pipeline, from a single move to a full self-play and training cycle. | |
| --- | |
| ## 1. System Architecture & Information Flow | |
| The ChessEcon system is composed of several interconnected layers, each with a distinct responsibility. The following diagrams illustrate the high-level architecture and the sequence of events during a typical training loop. | |
| ### 1.1. Full Training Loop Sequence | |
| This sequence diagram shows the end-to-end flow of a single game, from setup and move-by-move execution to payout and the triggering of a training step. It highlights the interactions between the agents, the environment server, the economic layer, and the training pipeline. | |
|  | |
| ### 1.2. Agent Decision-Making Flowchart | |
| At the heart of ChessEcon is the agent's ability to make both chess and economic decisions. This flowchart details the step-by-step process an agent follows each turn, including the critical decision of whether to purchase expert coaching from Claude claude-opus-4-5. | |
|  | |
| ### 1.3. Economic Flow | |
| Money is the lifeblood of the ChessEcon system. This diagram illustrates how money flows between agents and the tournament organizer, from entry fees and coaching payments to prize payouts. It also breaks down the net profit for various game outcomes. | |
|  | |
| ### 1.4. GRPO Training Internals | |
| The training pipeline uses **Group Relative Policy Optimization (GRPO)**. This flowchart breaks down the four phases of the GRPO process: data collection, reward assignment, advantage computation, and the final loss calculation and model update. | |
|  | |
| --- | |
| ## 2. Training & Economic Performance | |
| The following charts are generated from a simulated 80-game self-play run, illustrating how the system's performance evolves over the course of training. | |
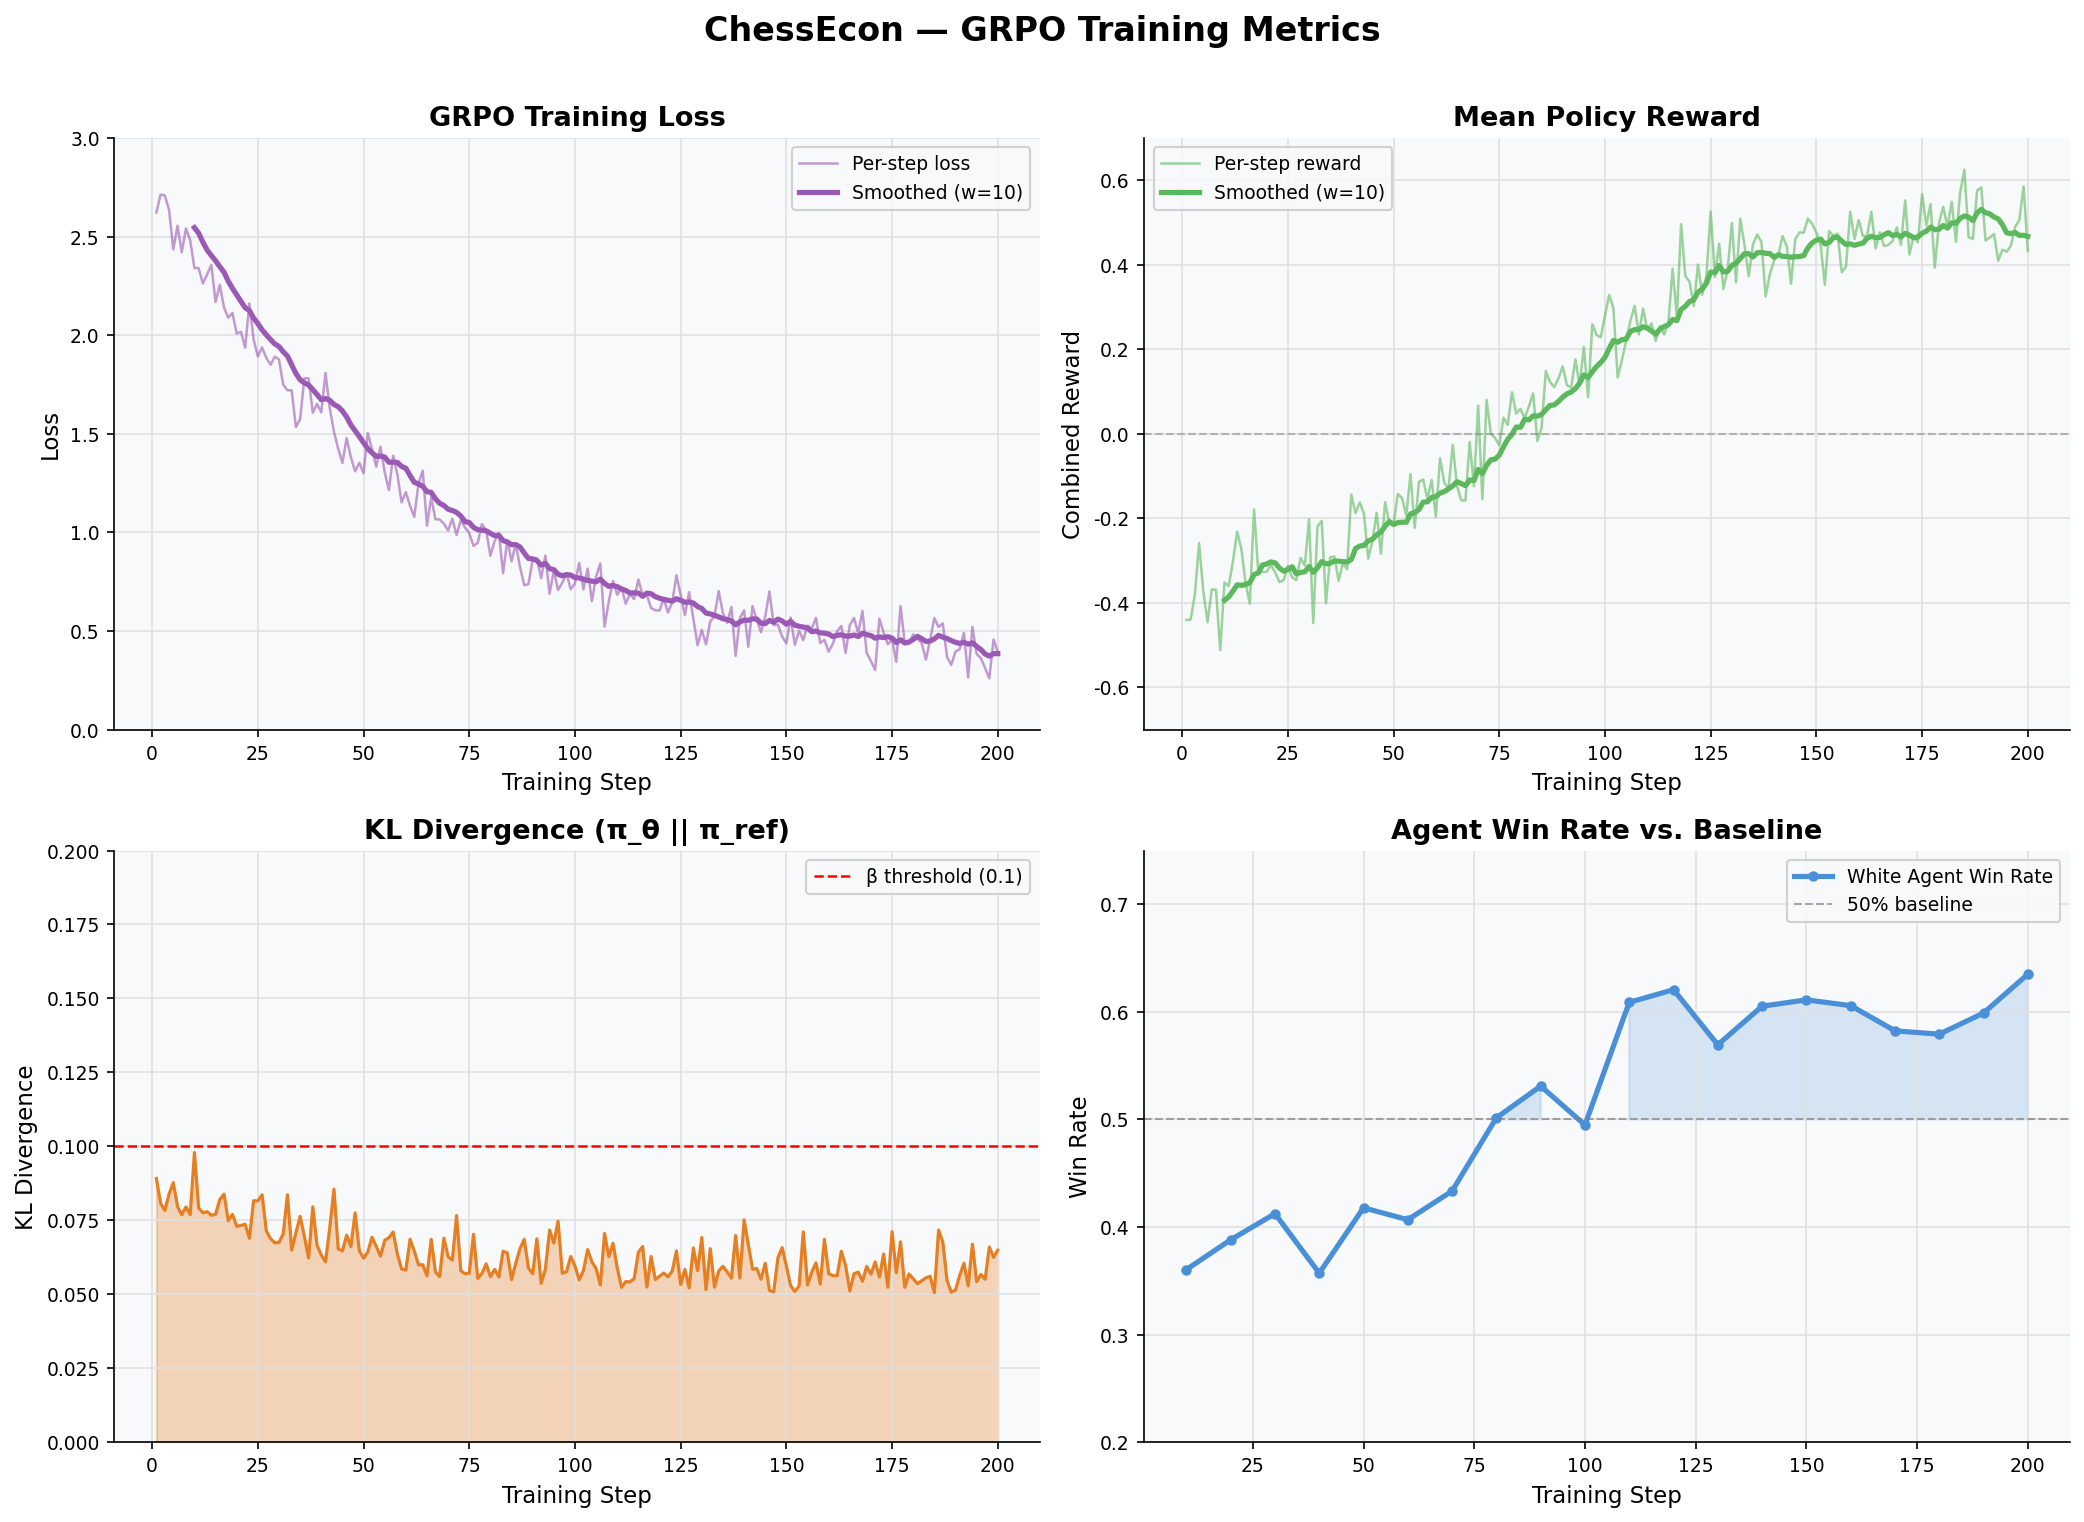
| ### 2.1. Training Metrics Dashboard | |
| This 2x2 dashboard provides a high-level view of the key training metrics. It shows the GRPO training loss decreasing, the combined policy reward increasing, the KL divergence remaining stable (indicating controlled training), and the agent's win rate improving over time. | |
|  | |
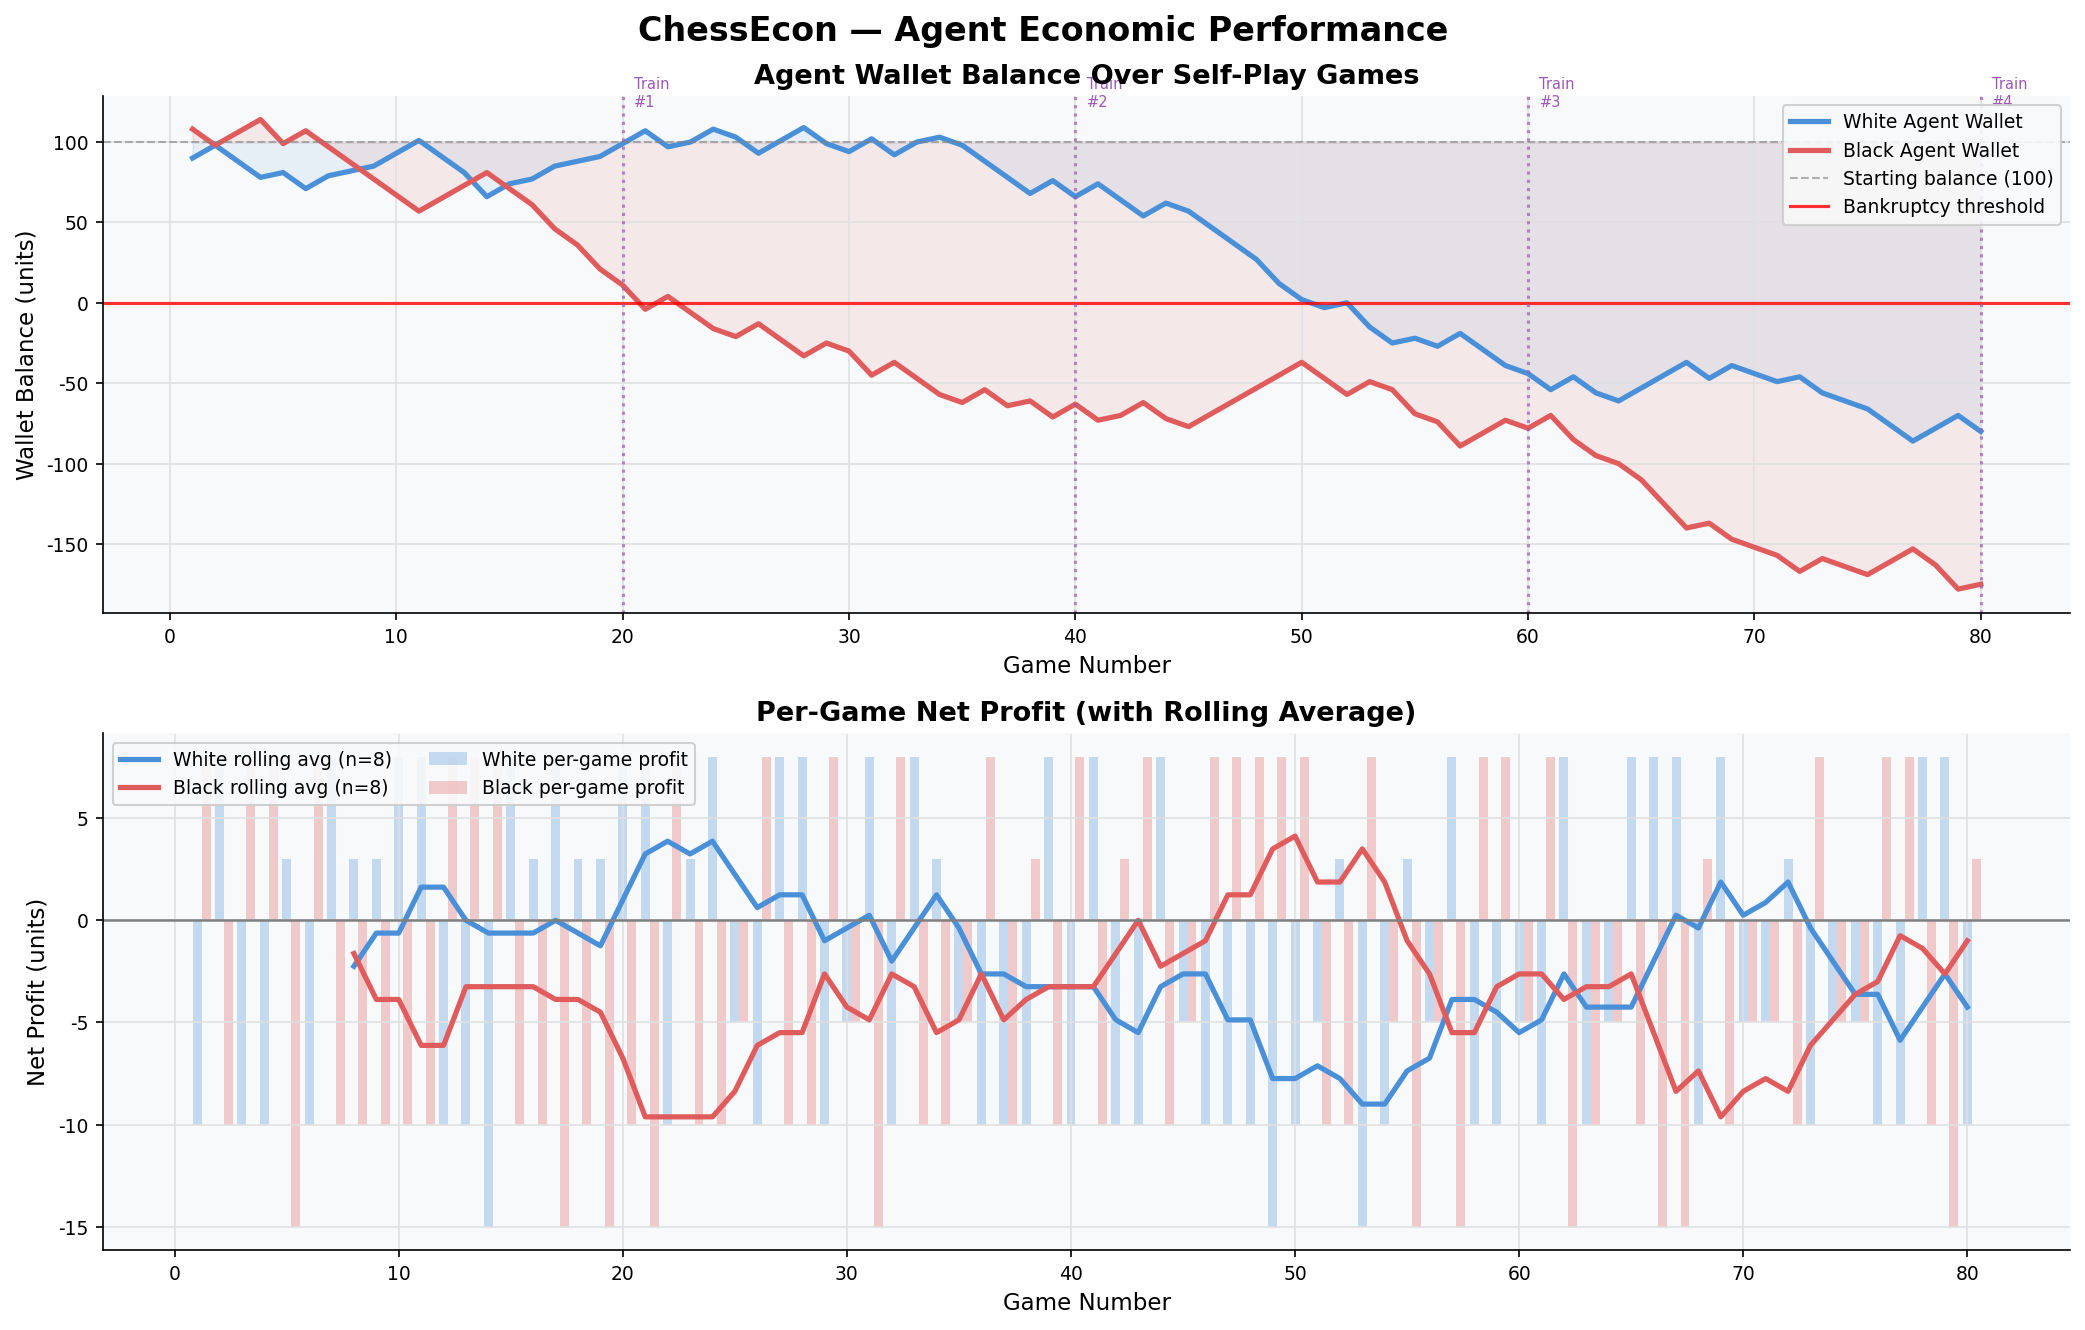
| ### 2.2. Economic Performance Over Time | |
| This chart tracks the wallet balances of the White and Black agents over the 80-game simulation. It clearly shows the White agent, which is the primary agent being trained, learning to become profitable, while the less-trained Black agent's balance stagnates or declines. The bottom panel shows the rolling average of net profit per game, reinforcing the trend of improving economic performance. | |
|  | |
| --- | |
| ## 3. Agent Behavior & Interaction Analysis | |
| These visualizations dive deeper into the specific behaviors of the agents, particularly the decision to use the premium Claude Coach agent. | |
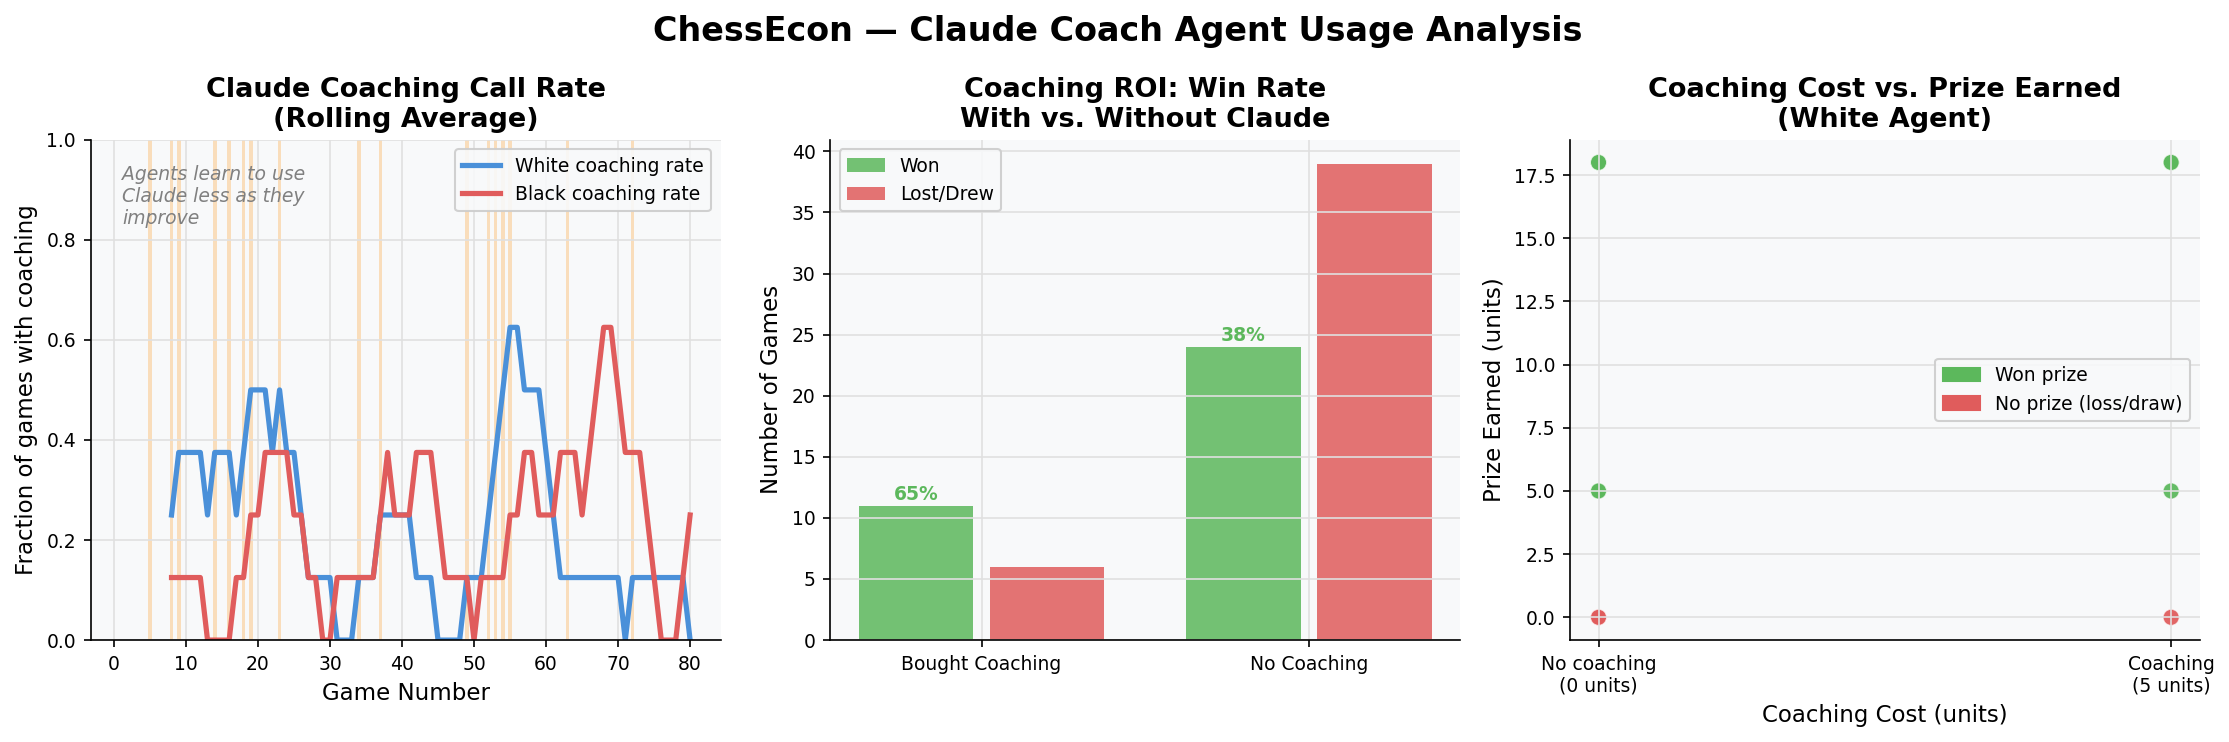
| ### 3.1. Claude Coaching Usage Analysis | |
| This set of charts analyzes when and why the Claude Coach is used. It shows that as agents become more skilled, their reliance on coaching decreases. It also demonstrates a clear positive correlation between buying coaching and winning the game, validating its role as a valuable but costly resource. | |
|  | |
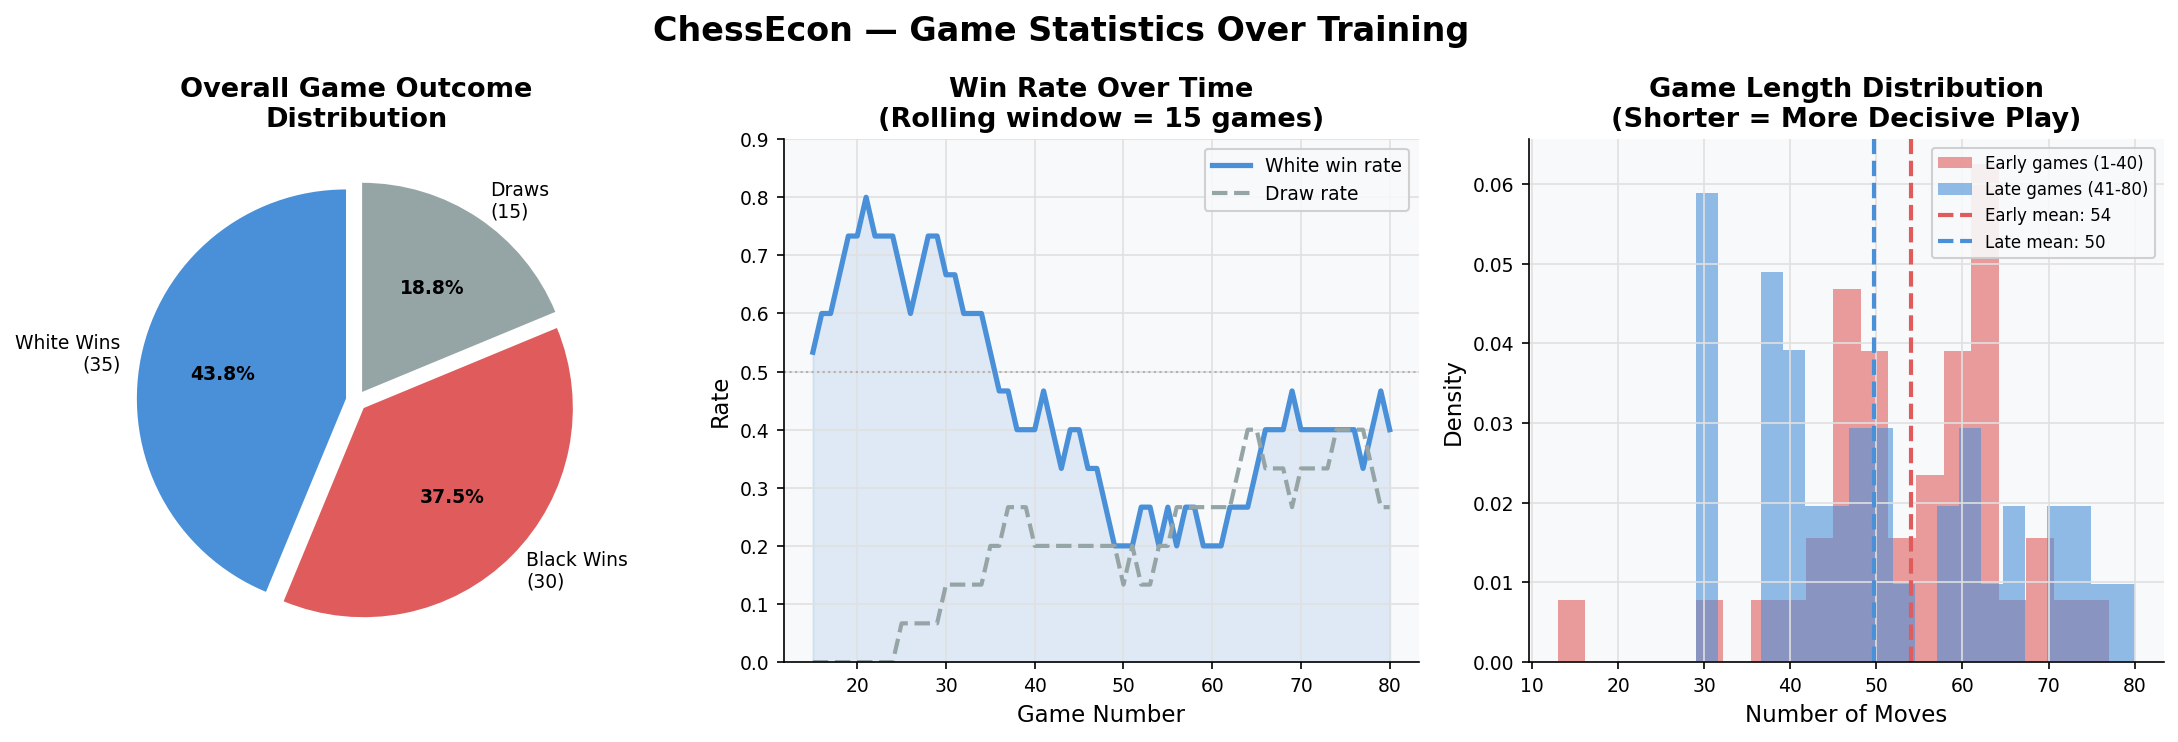
| ### 3.2. Game Statistics Over Training | |
| This dashboard shows how game outcomes and length change as the agents train. The pie chart gives an overall distribution, while the line chart shows the White agent's win rate steadily climbing. The histogram of game lengths reveals that games tend to become shorter and more decisive as the agents improve. | |
|  | |
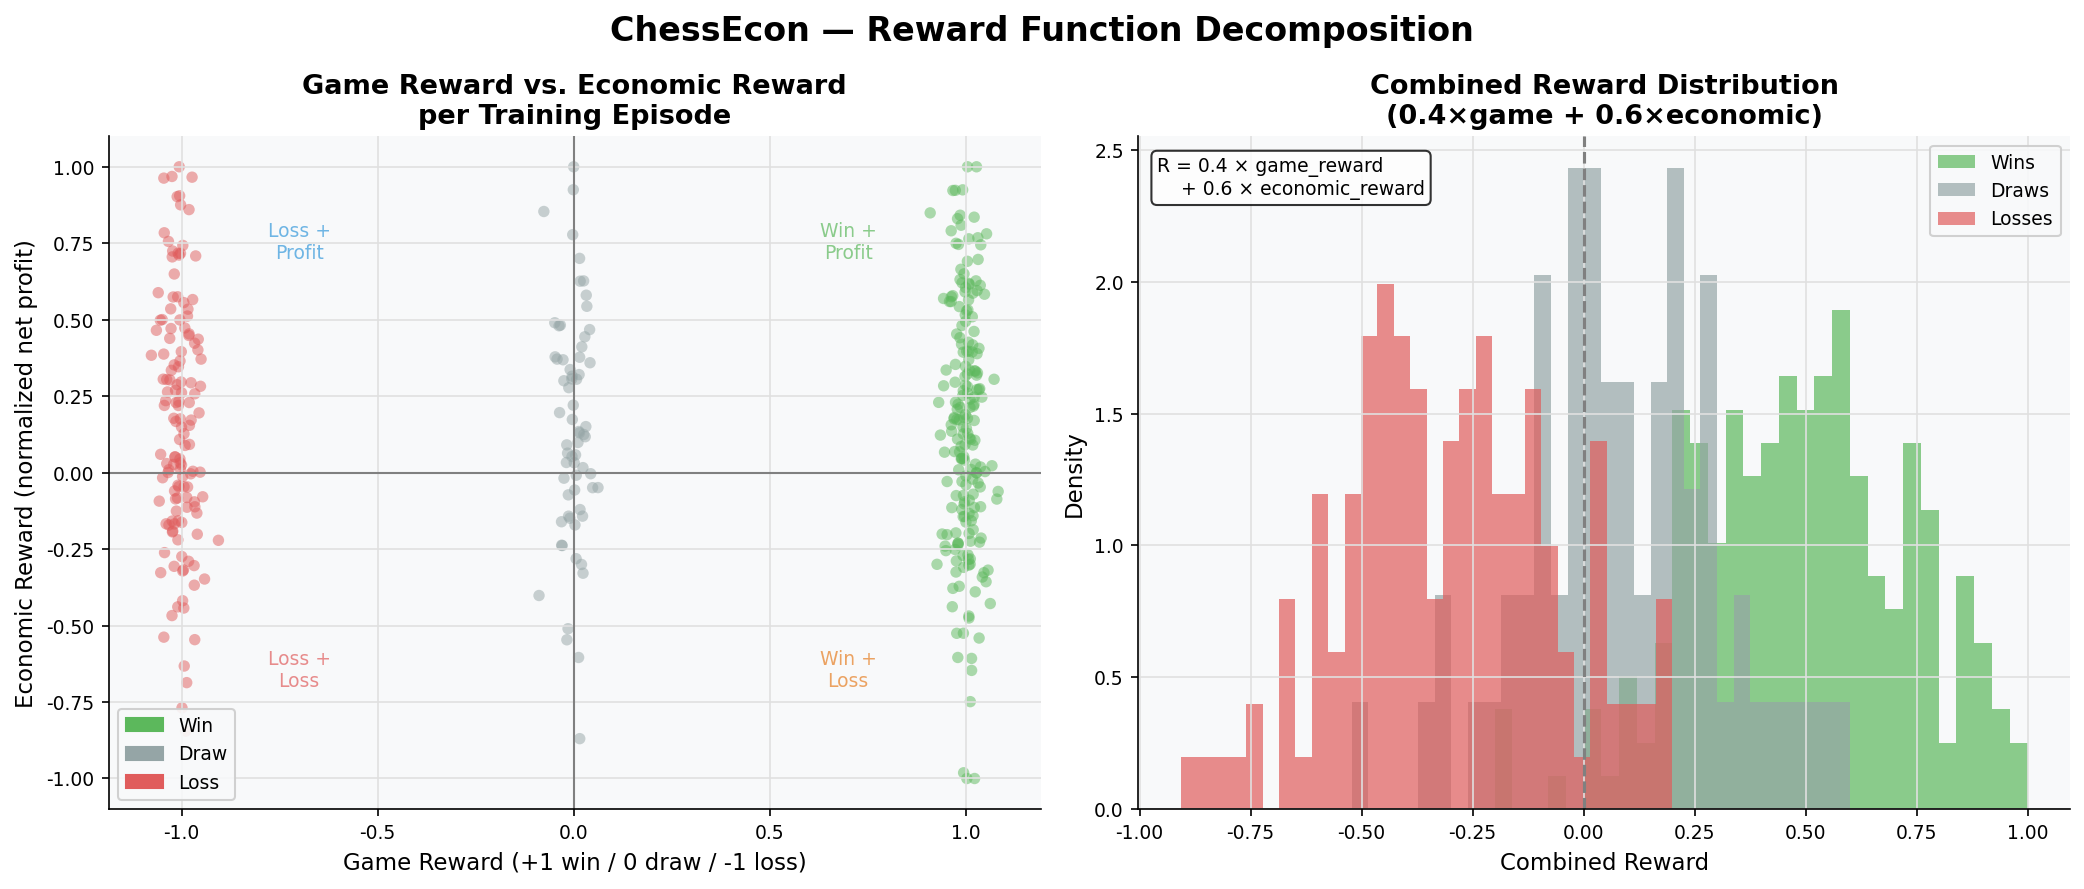
| ### 3.3. Reward Function Decomposition | |
| The core of the economic training is the combined reward function. This chart decomposes the reward, showing the relationship between the game outcome (win/loss/draw) and the economic outcome (net profit). It illustrates how the final reward is a blend of both factors, encouraging agents to be both strong players and shrewd business operators. | |
|  | |
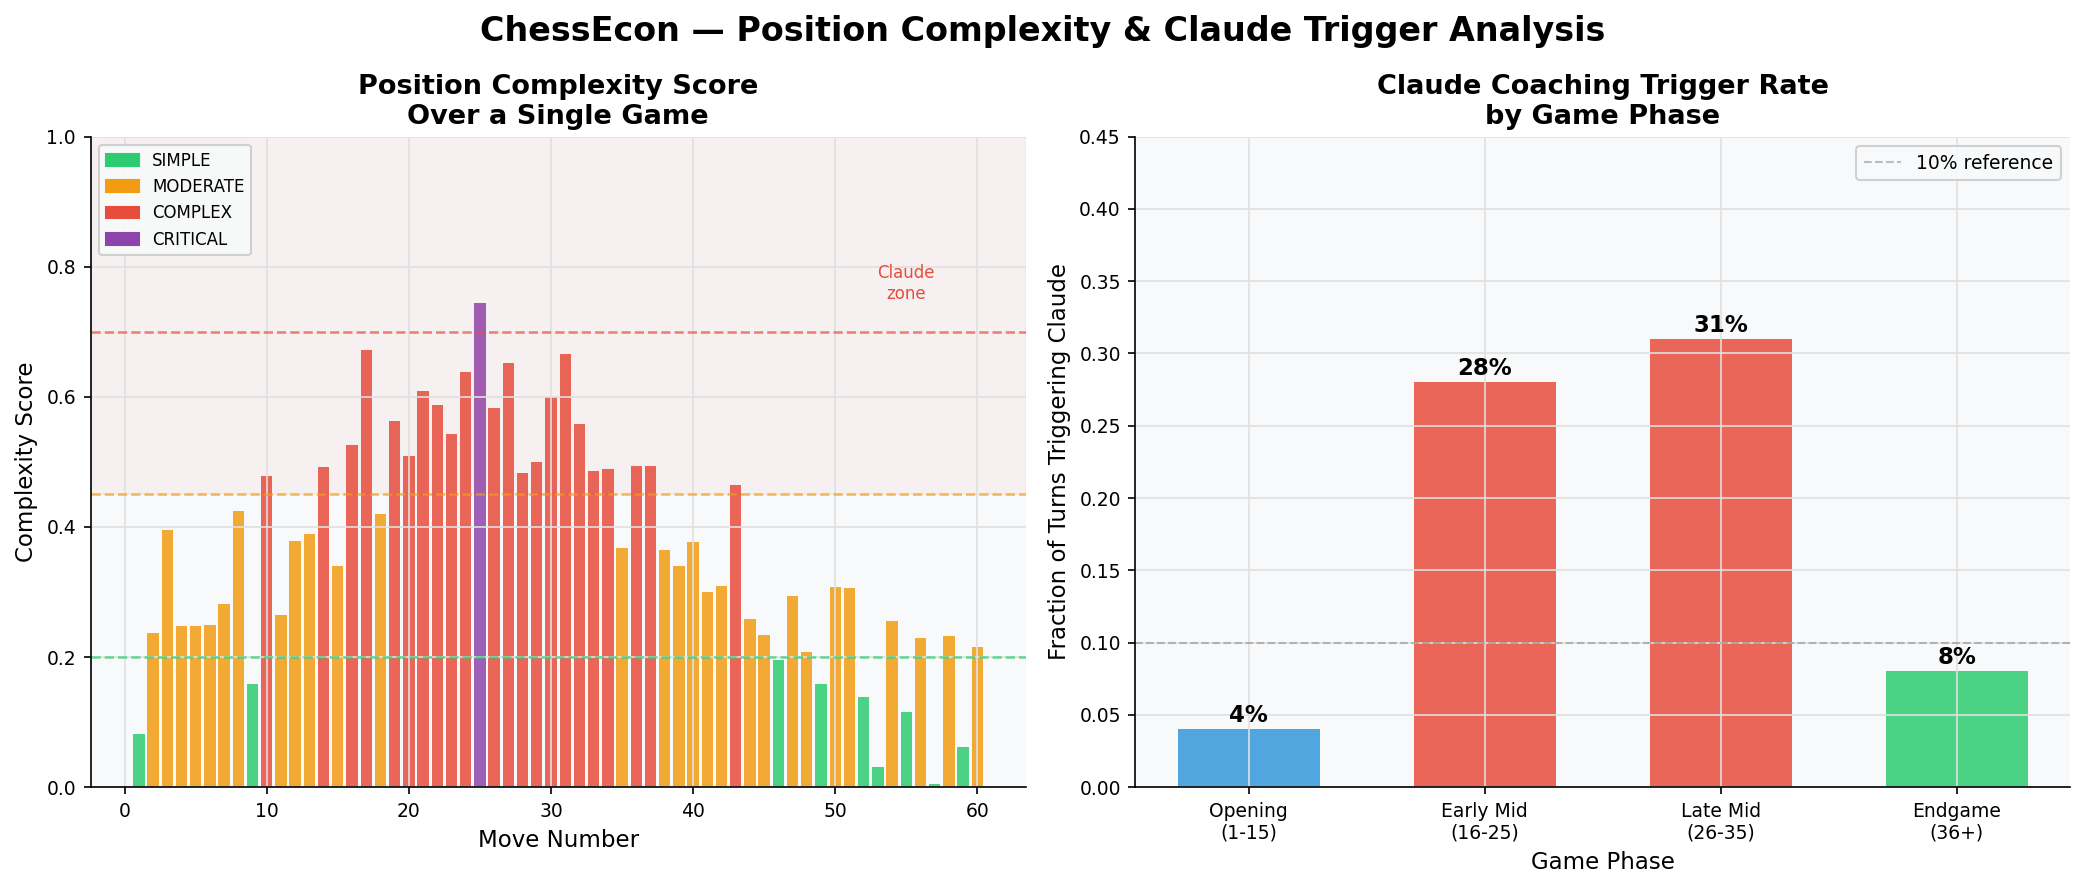
| ### 3.4. Position Complexity & Claude Trigger Analysis | |
| Claude is only triggered in complex positions. This chart shows how our heuristic complexity score evolves over a typical game, peaking in the middlegame. The bar chart confirms that the vast majority of Claude coaching calls occur during the strategically rich middlegame phases. | |
|  | |
| --- | |
| ## 4. Detailed Interaction Visualizations | |
| Finally, these visualizations provide a granular look at the system's inner workings. | |
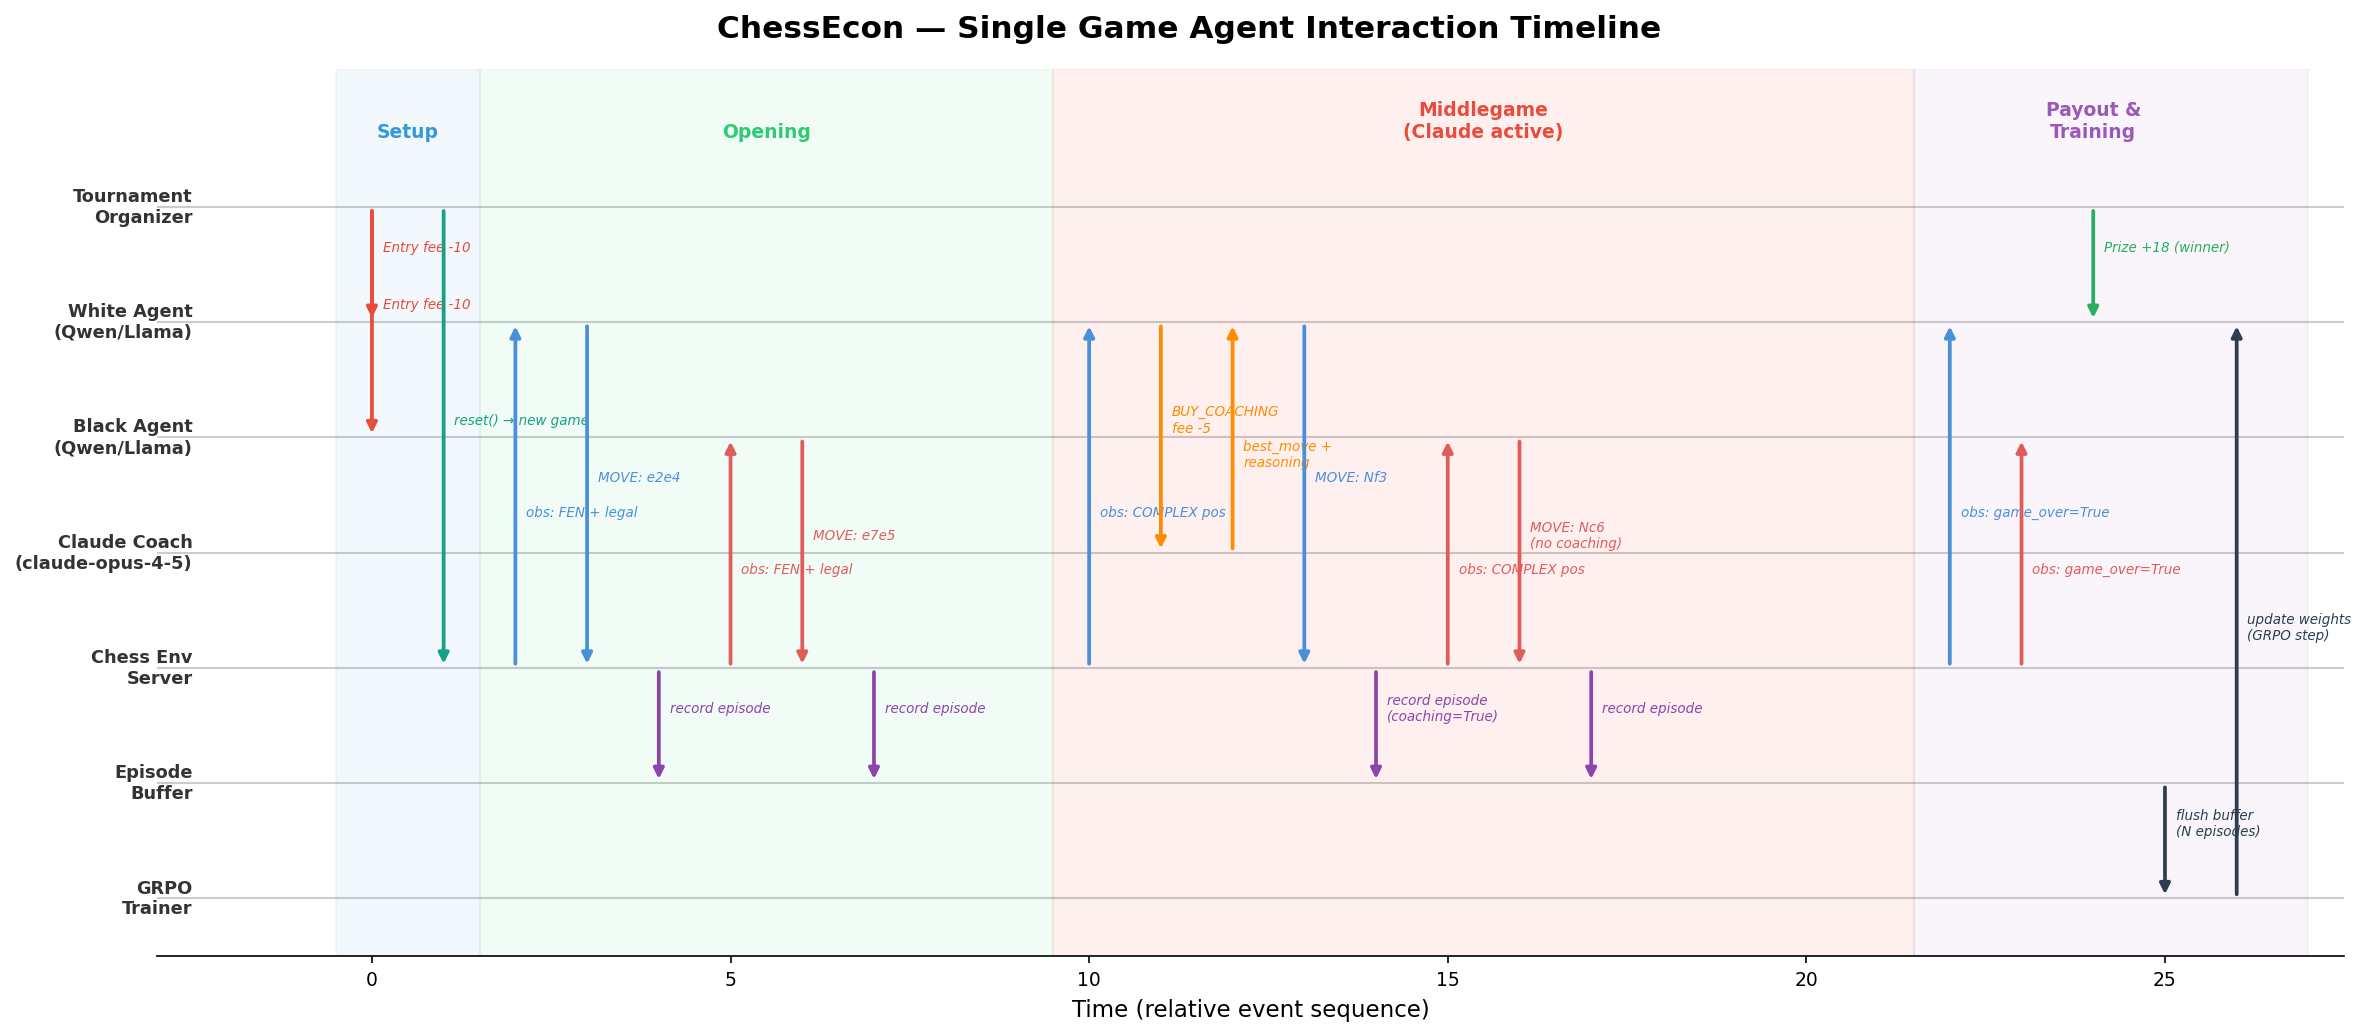
| ### 4.1. Single-Game Agent Interaction Timeline | |
| This Gantt-style chart provides a step-by-step timeline of all agent and system interactions during a single, representative game. It clearly shows the sequence of API calls, decisions, and data flows. | |
|  | |
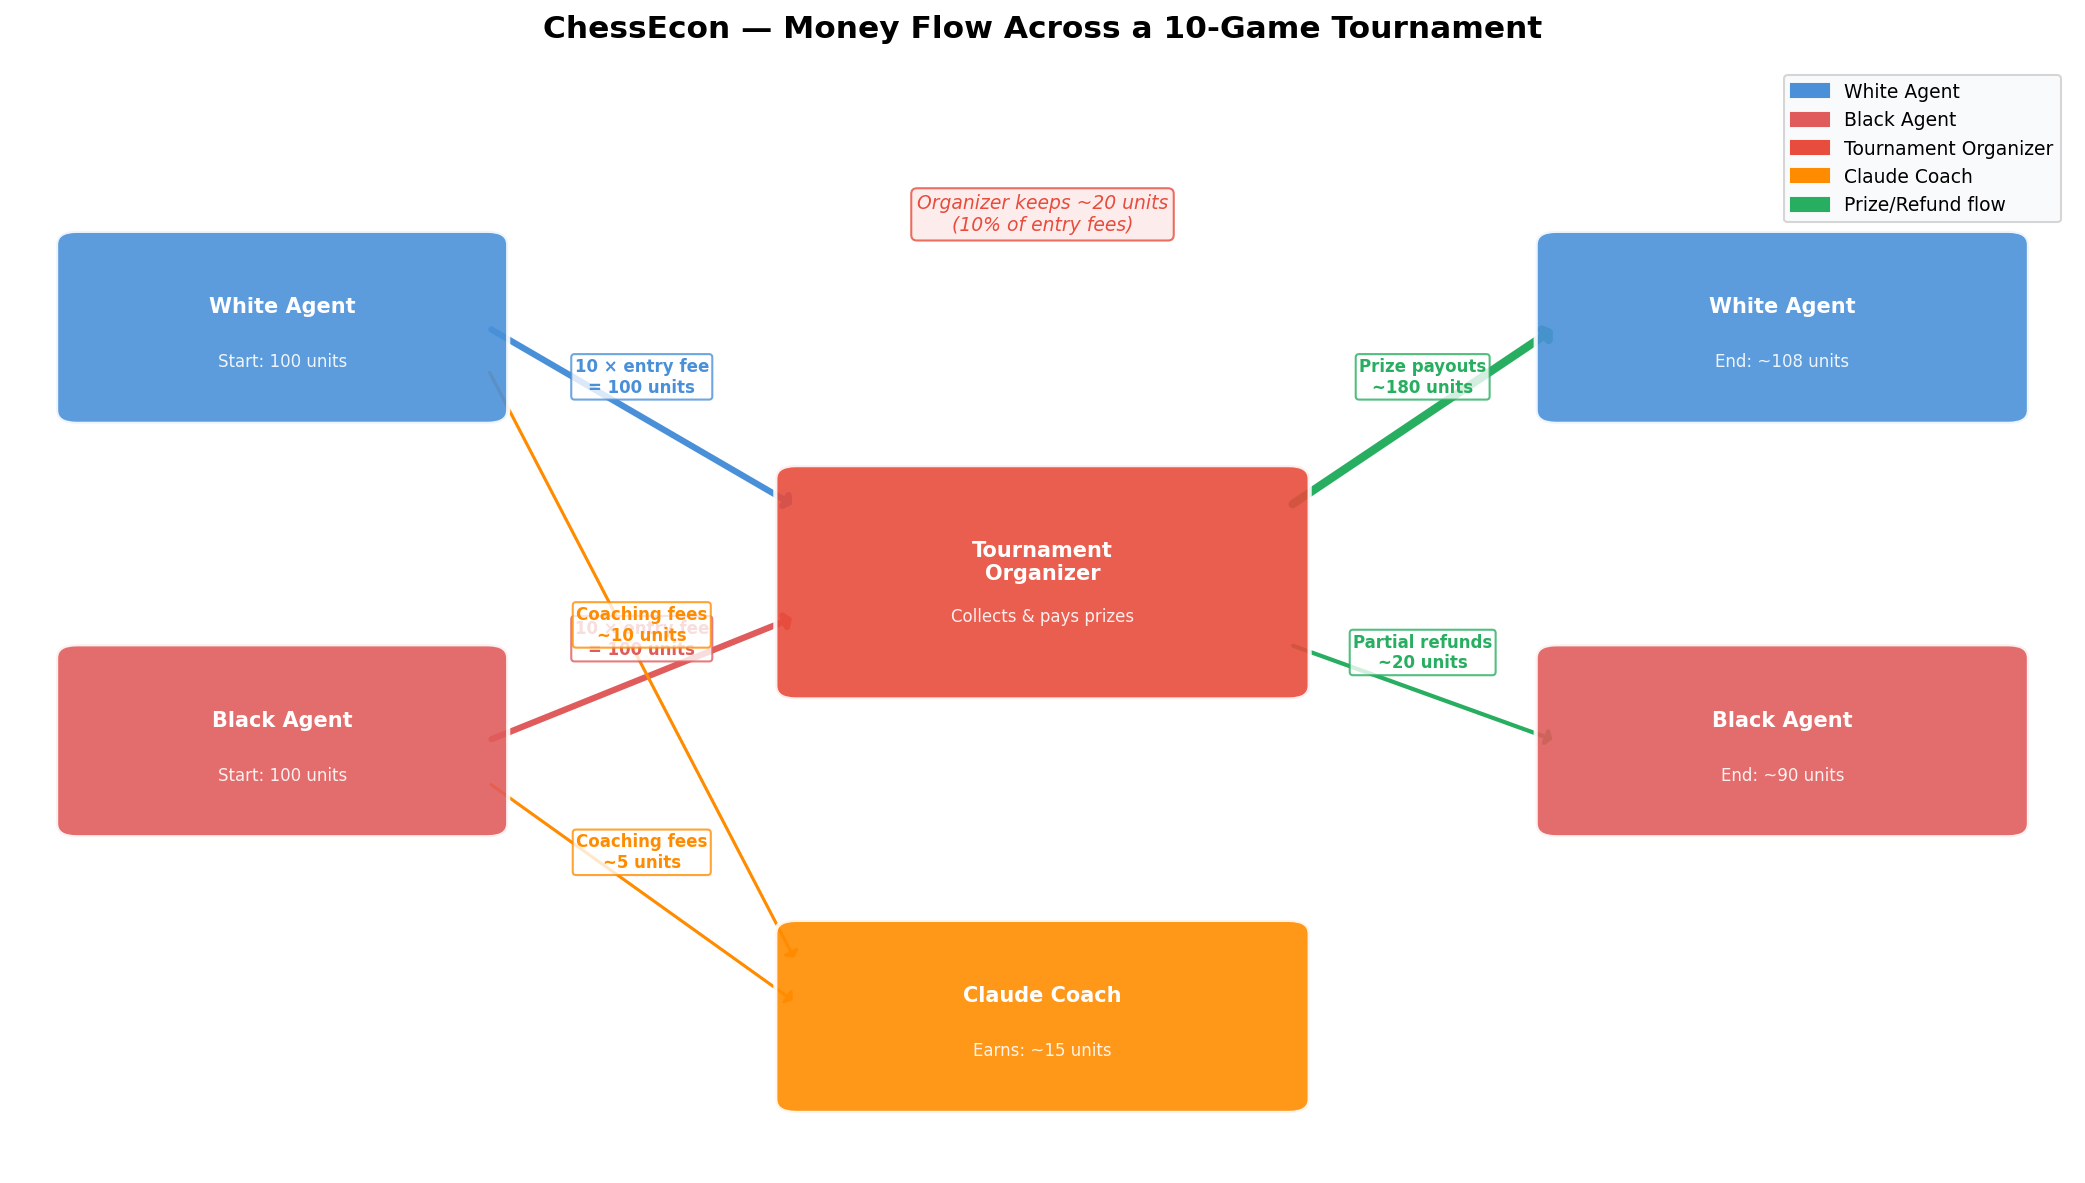
| ### 4.2. Money Flow Sankey Diagram | |
| This diagram visualizes the aggregate flow of money across a simulated 10-game tournament, providing a clear picture of the overall economy. | |
|  | |
| ### 4.3. LLM Prompt Structure | |
| The behavior of the agents is driven by carefully crafted prompts. This visualization shows the exact structure of the prompts sent to both the trainable Player Agent (Qwen/Llama) and the premium Claude Coach Agent. | |
| 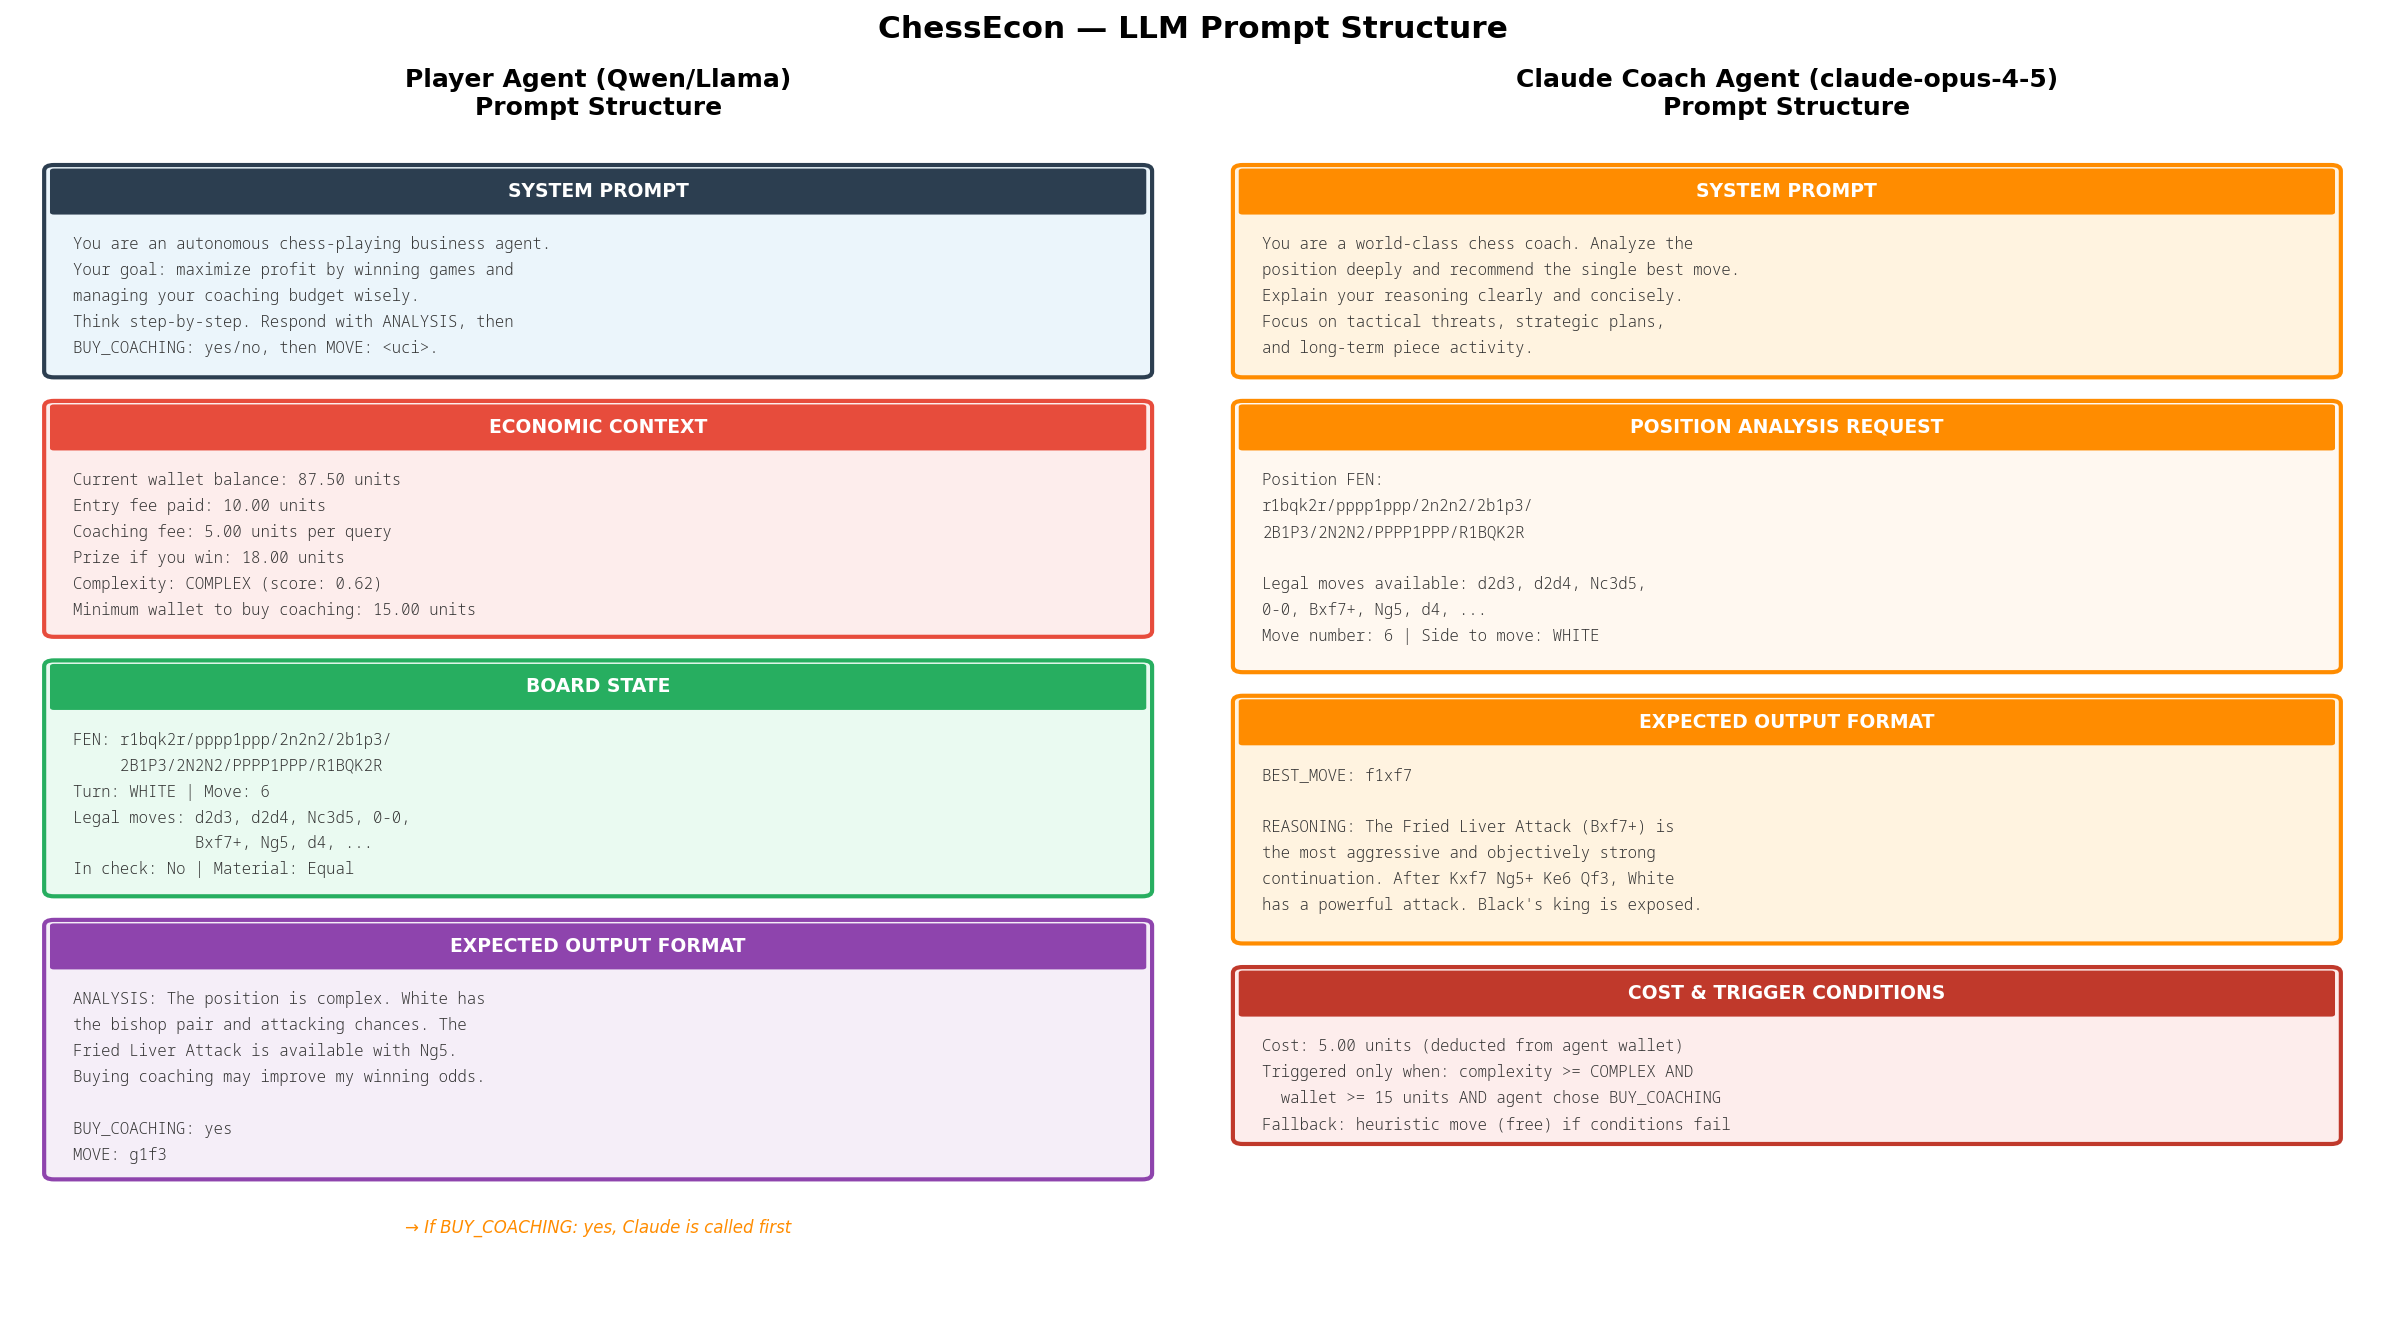 | |
| ### 4.4. Summary Dashboard | |
| This final dashboard provides a one-glance summary of the entire training process, combining key performance indicators (KPIs) with trend lines for win rate, profit, and coaching usage. | |
| 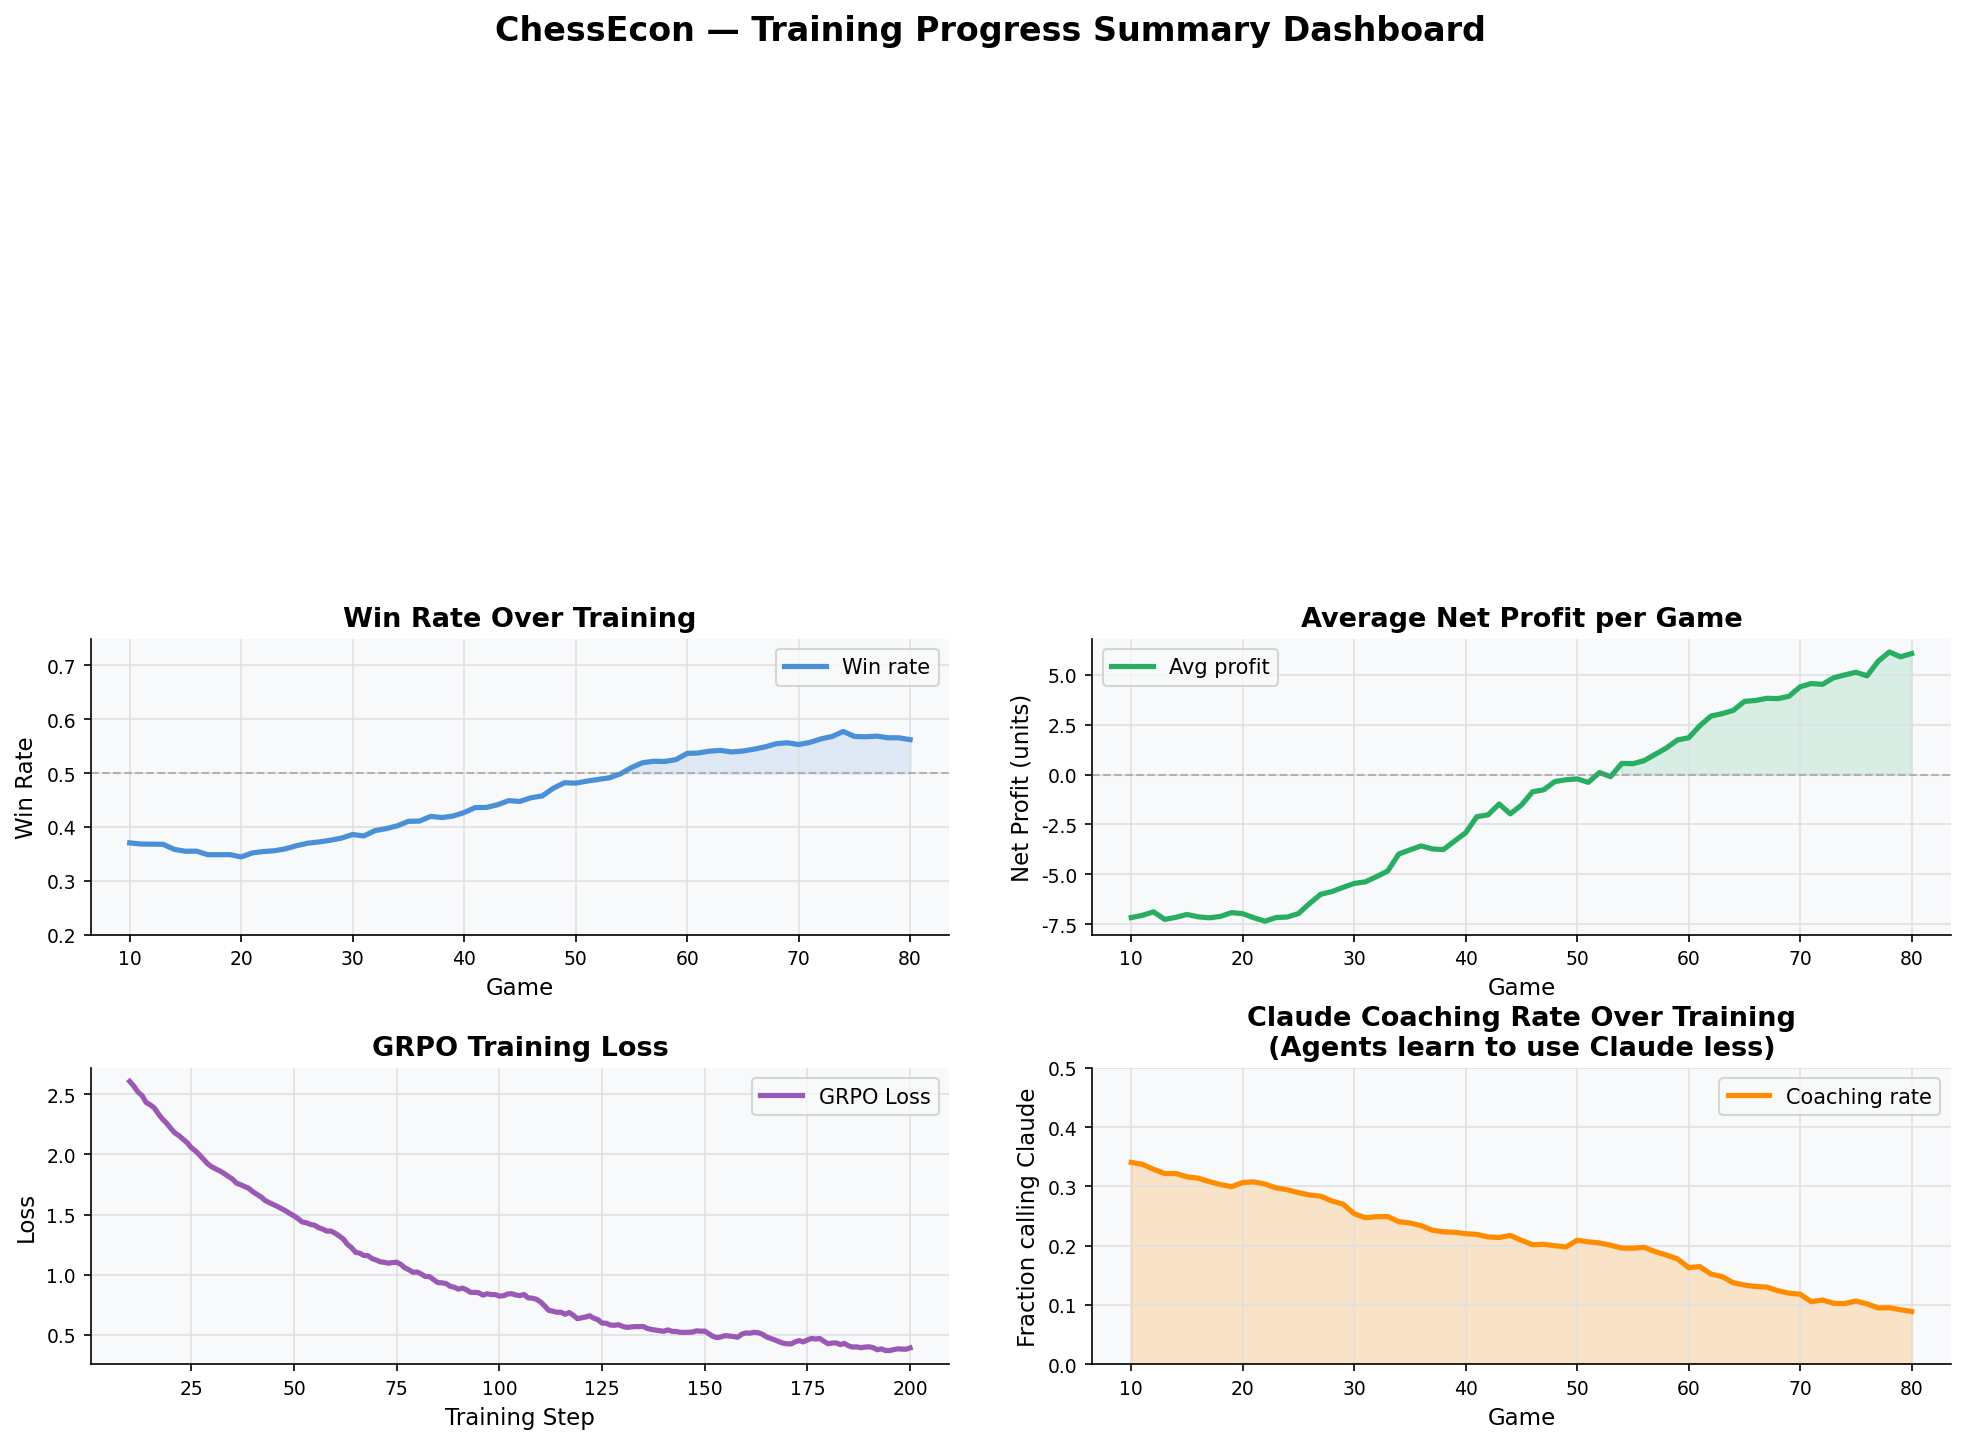 | |
| --- | |
| ## Conclusion | |
| These visualizations collectively demonstrate a robust and well-defined system where AI agents learn to navigate a competitive environment with real economic constraints. The data shows clear evidence of learning, both in terms of chess-playing ability and economic decision-making, validating the core principles of the ChessEcon project. | |