|
|
--- |
|
|
license: gpl-3.0 |
|
|
datasets: |
|
|
- Kaynaaf/Brain-Tumour-MRI |
|
|
metrics: |
|
|
- accuracy 0.90 |
|
|
- precision 0.90 |
|
|
library_name: keras |
|
|
tags: |
|
|
- medical |
|
|
- healthcare |
|
|
--- |
|
|
|
|
|
# Model Card |
|
|
|
|
|
An Image Classifier that predicts the presence of certain Brain tumours from their MRI scans |
|
|
|
|
|
## Model Details |
|
|
A 134M Parameter ConvNet designed for classification of Brain tumours in MRI scans. |
|
|
|
|
|
## Paper |
|
|
|
|
|
Interpretable Deep Learning for Brain Tumor Diagnosis: Occlusion Sensitivity-Driven Explainability in MRI Classification |
|
|
DOI: [10.21015/vtse.v13i2.2082](10.21015/vtse.v13i2.2082) |
|
|
|
|
|
## Uses |
|
|
|
|
|
|
|
|
### Direct Use |
|
|
|
|
|
Load the model, finetune the model if needed or just go straight towards generating inferences using the model. |
|
|
|
|
|
|
|
|
|
|
|
### Downstream Use |
|
|
|
|
|
Finetune the model on other diagnostic scans, though the model only accepts grayscale images of size 256x256. |
|
|
|
|
|
## How to Get Started with the Model |
|
|
|
|
|
[](https://colab.research.google.com/drive/1SfK9d2In3JHDvyXH4jpwznVGEG_wXRuQ?usp=sharing) |
|
|
|
|
|
## Training |
|
|
The colab notebook used to train the model can be found below |
|
|
|
|
|
[](https://colab.research.google.com/drive/1SfK9d2In3JHDvyXH4jpwznVGEG_wXRuQ?usp=sharing) |
|
|
|
|
|
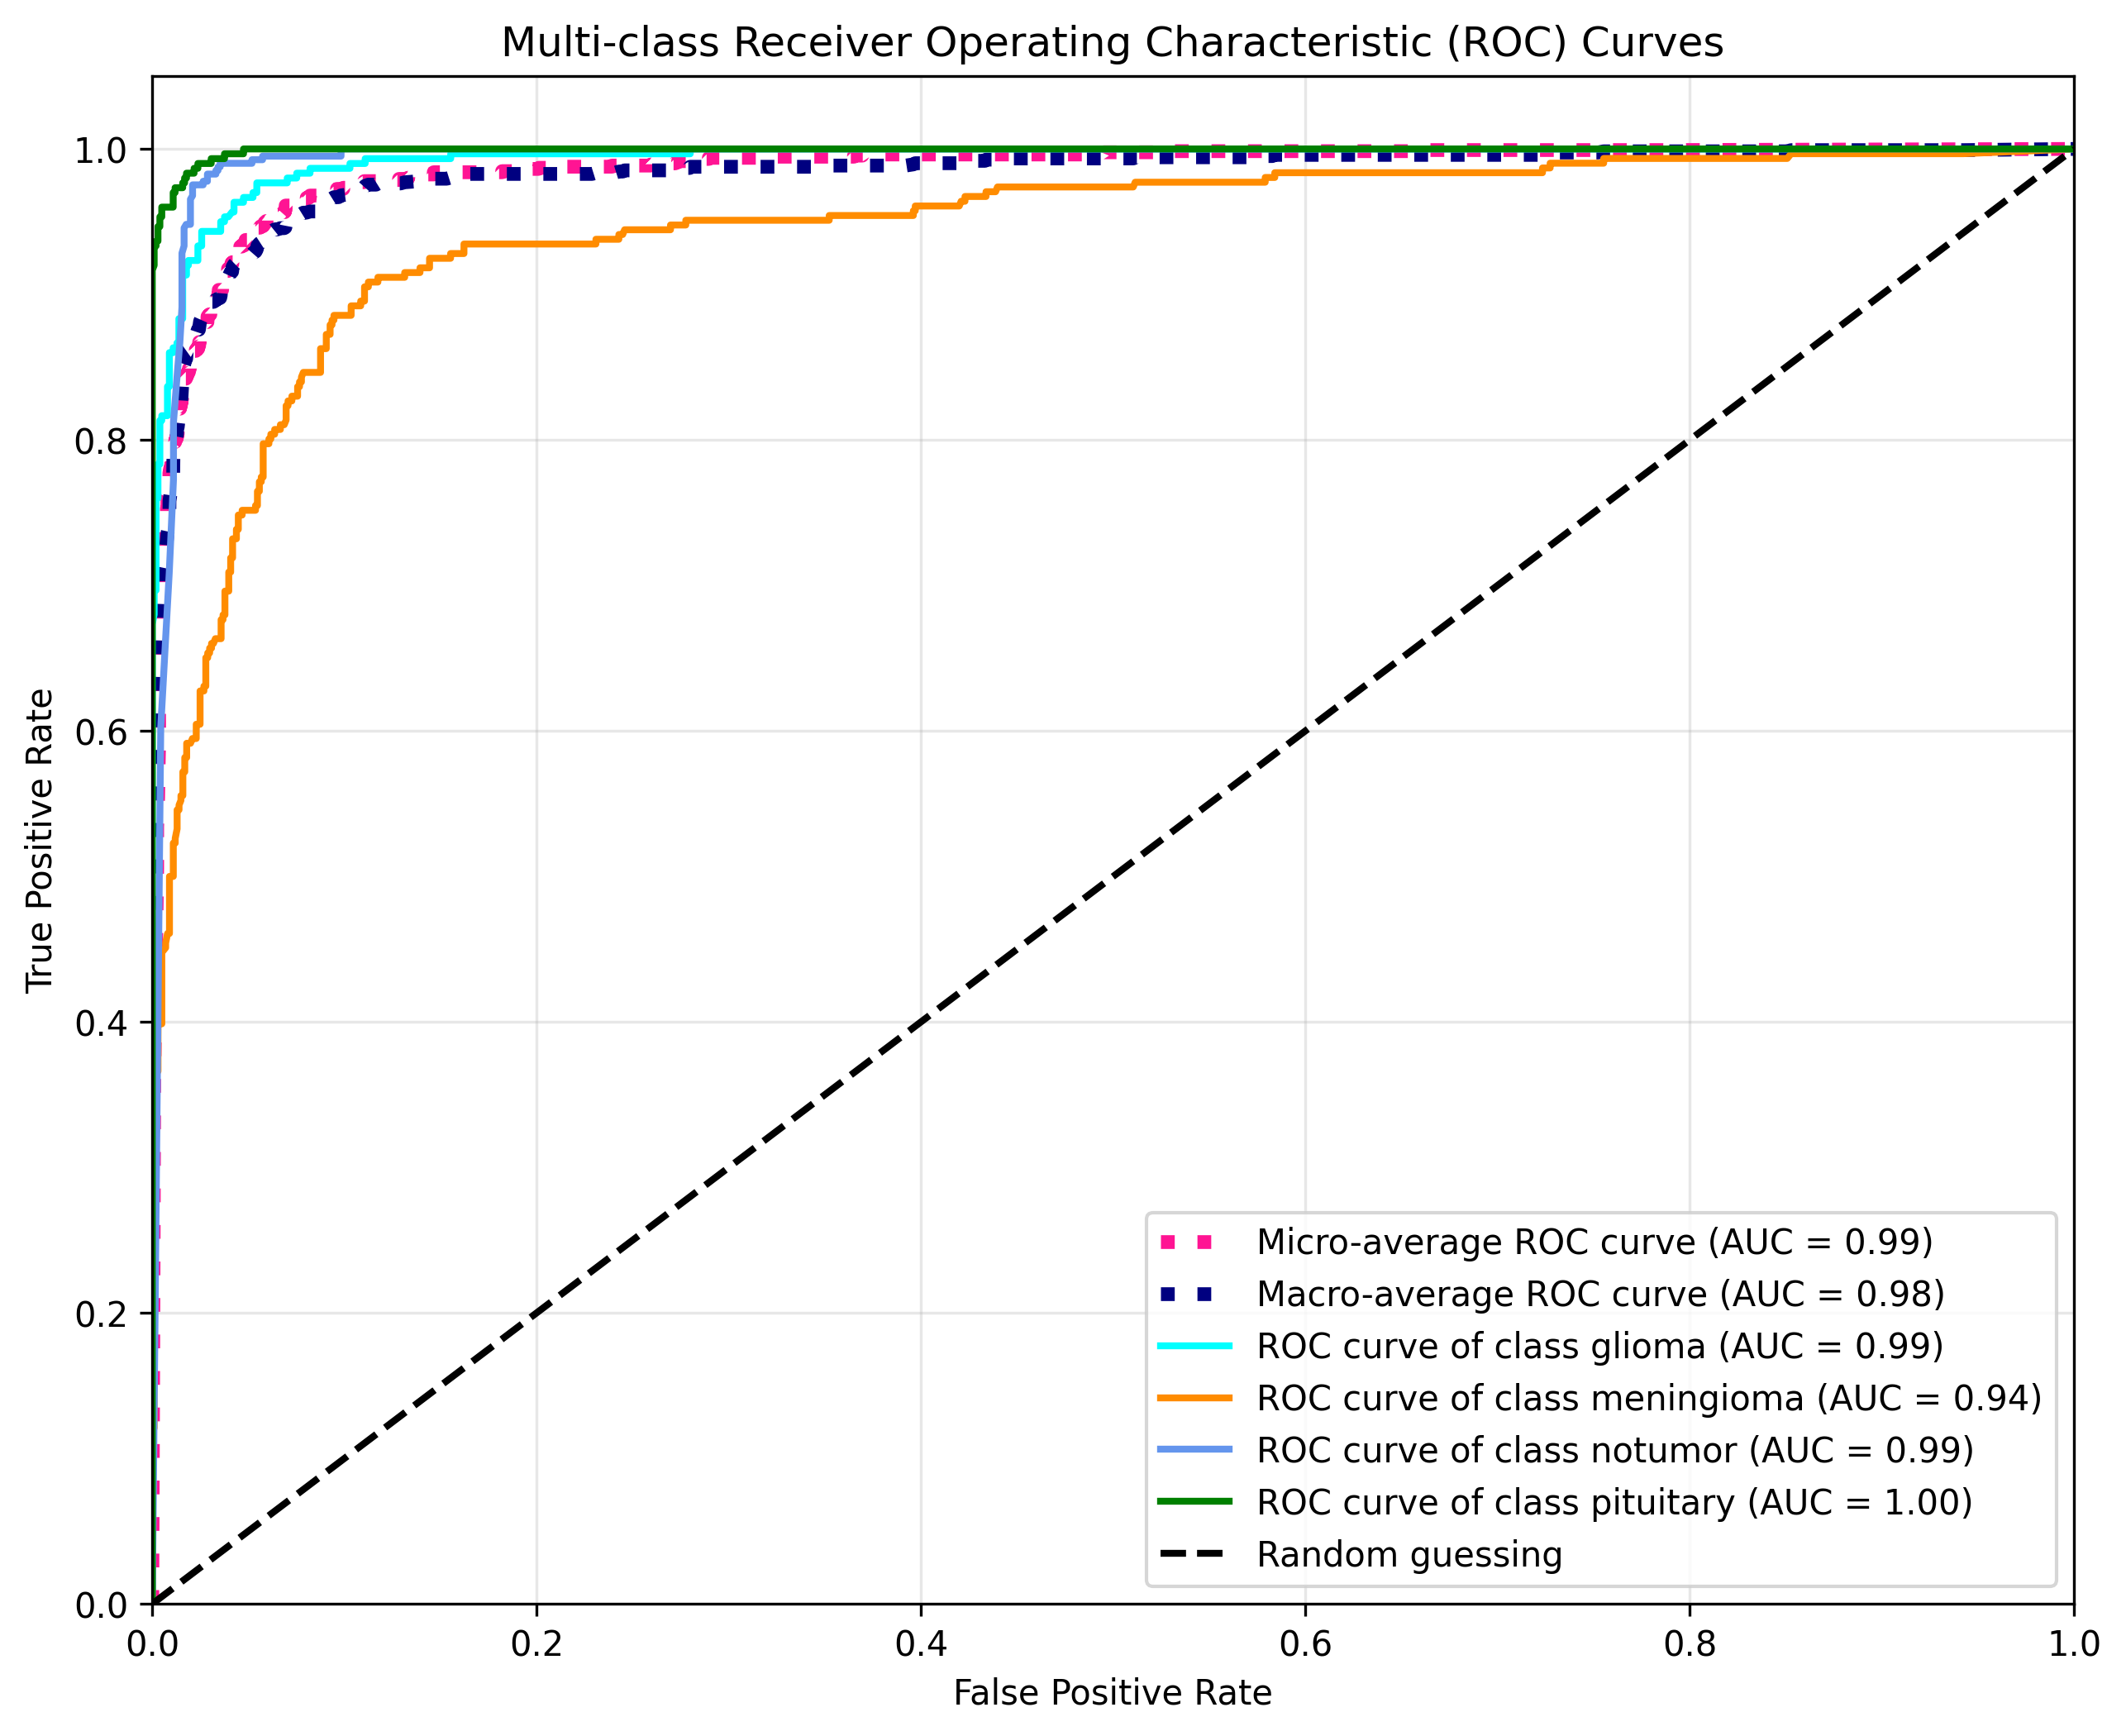
## Evaluation |
|
|
|
|
|
### Metrics |
|
|
|
|
|
| Class | Precision | Recall | F1-Score | Support | |
|
|
|-------------|-----------|--------|----------|---------| |
|
|
| Glioma | 0.96 | 0.87 | 0.91 | 300 | |
|
|
| Meningioma | 0.84 | 0.71 | 0.77 | 306 | |
|
|
| No Tumor | 0.88 | 1.00 | 0.93 | 405 | |
|
|
| Pituitary | 0.93 | 0.99 | 0.96 | 300 | |
|
|
| **Accuracy**| | | **0.90** | 1311 | |
|
|
| **Macro Avg** | 0.90 | 0.89 | 0.89 | 1311 | |
|
|
| **Weighted Avg** | 0.90 | 0.90 | 0.90 | 1311 | |
|
|
|
|
|
 |
|
|
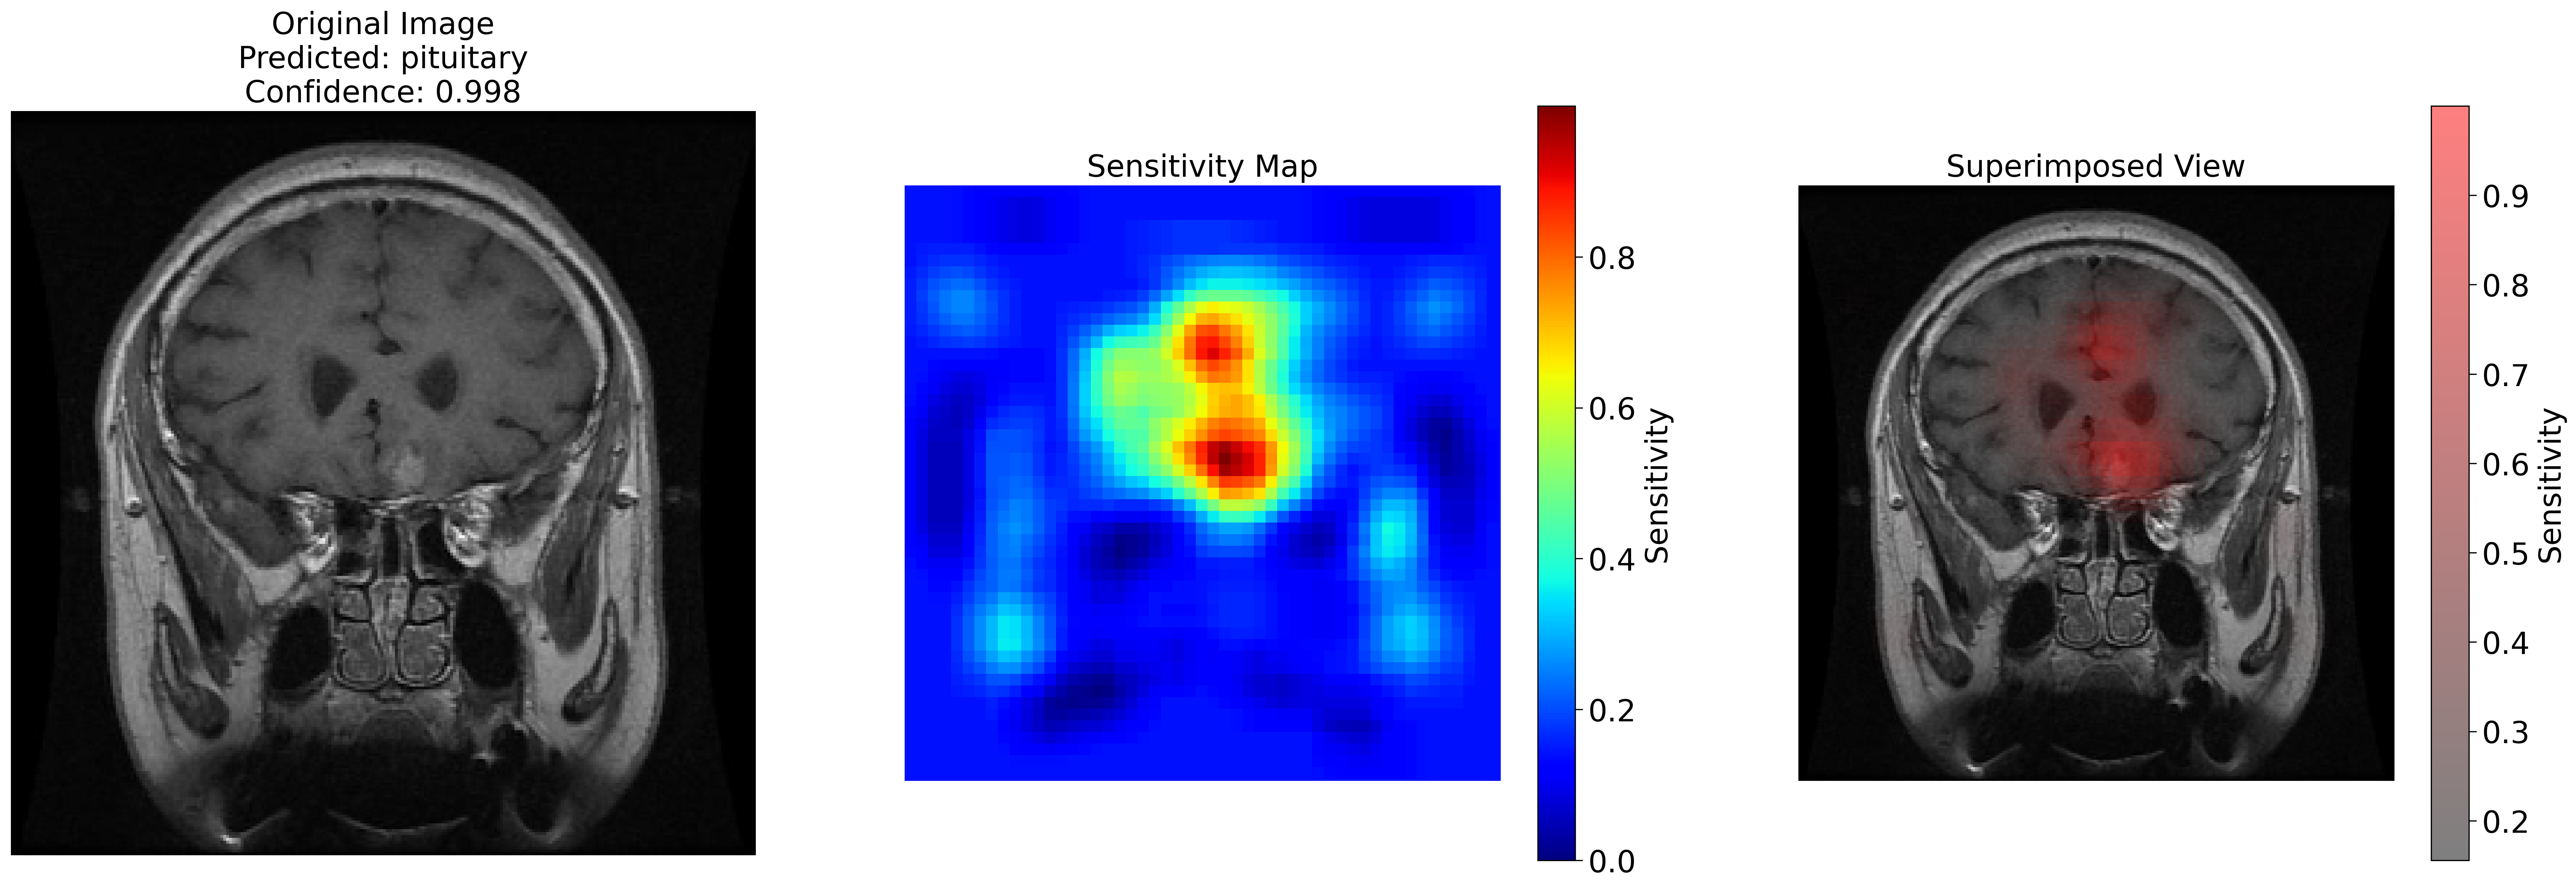
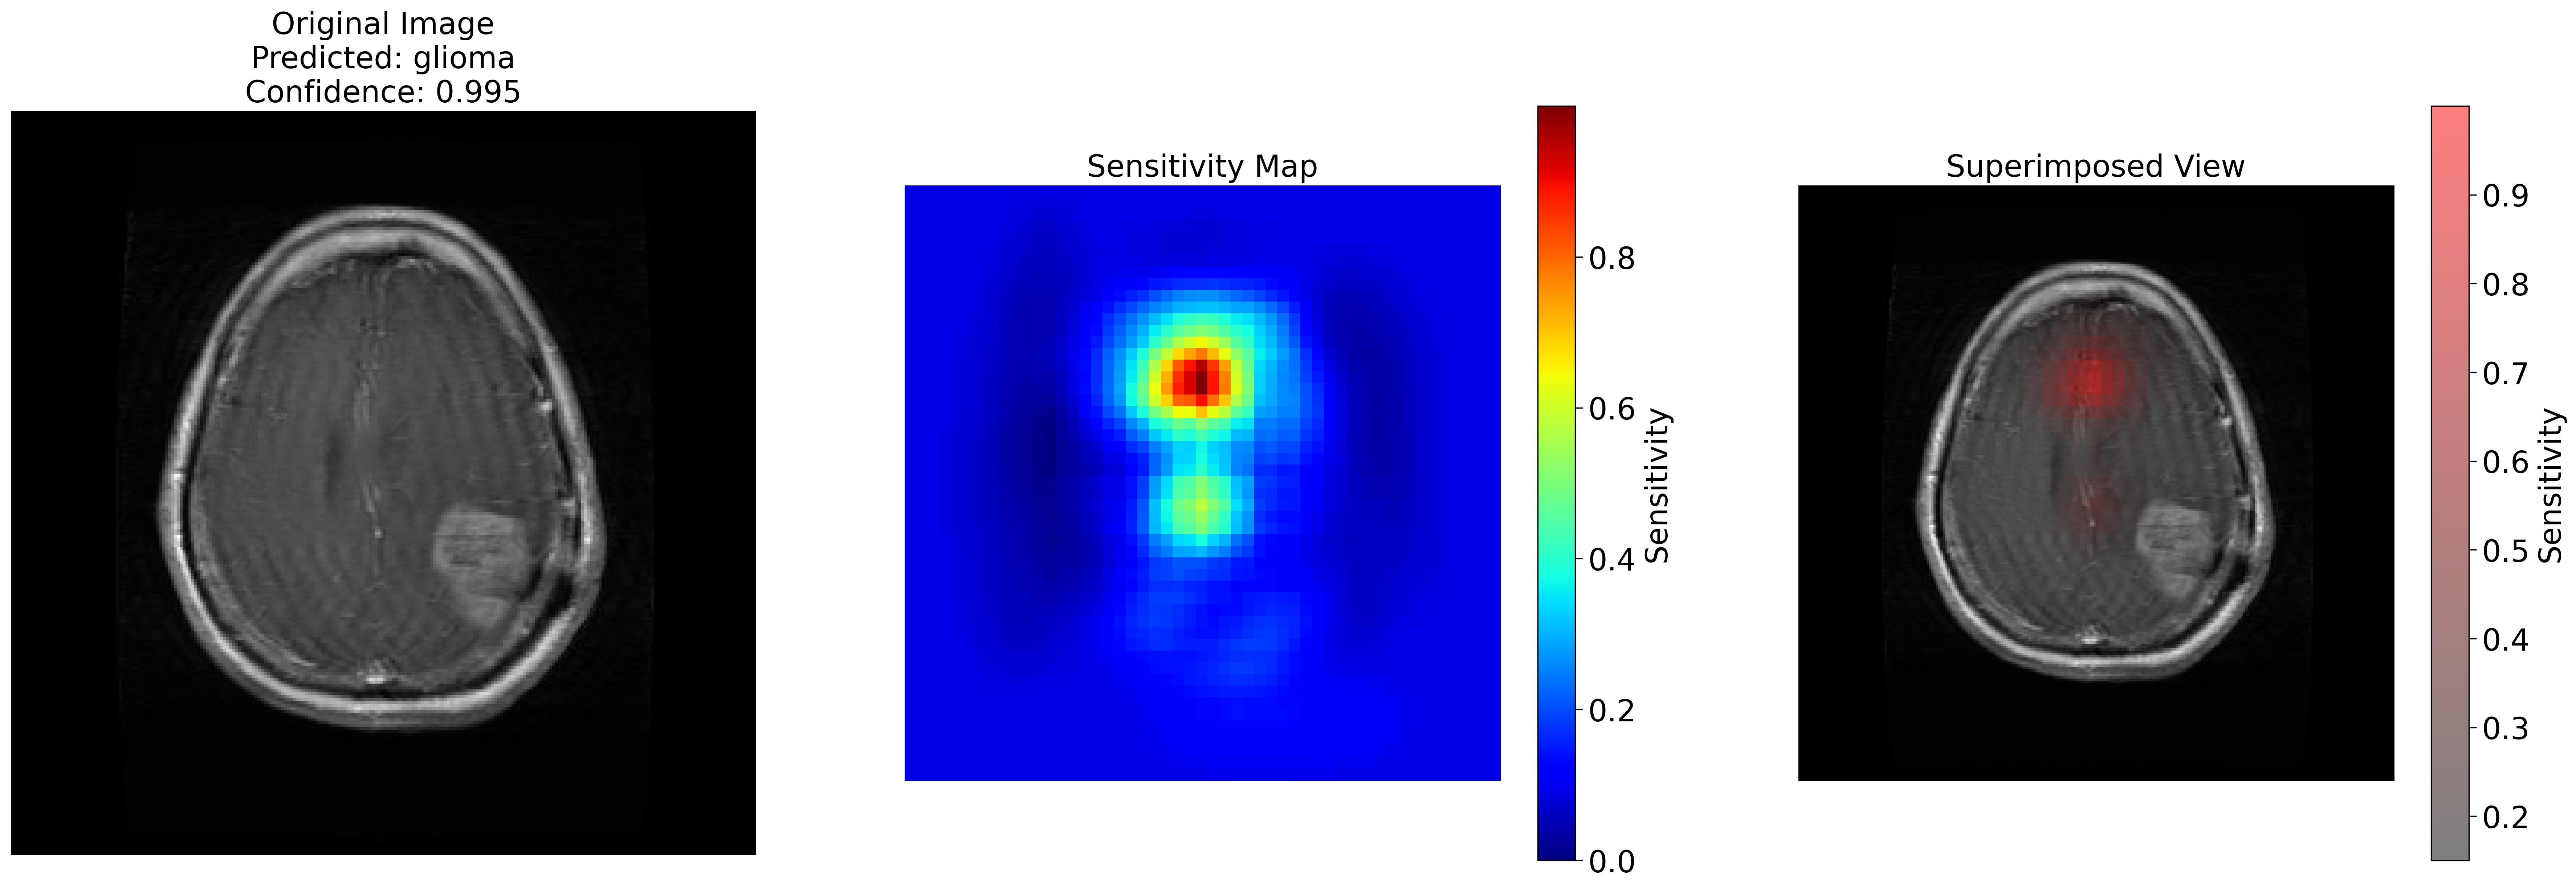
### Results |
|
|
This model was developed for my project that can be found on github [here](https://github.com/Kaynaaf/BrainMRI-Classifier) |
|
|
. This project involved generating sensitivity maps to explain the predictions of the model. |
|
|
These maps assign values to areas of the image that act as feature importance markers. |
|
|
 |
|
|
 |
|
|
|
|
|
|
|
|
|
